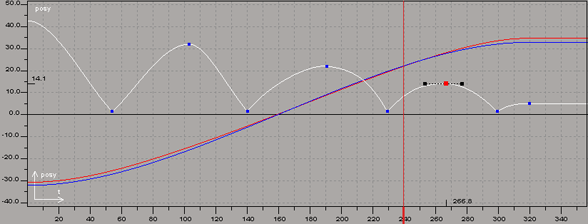
When you set keyframes to animate a parameter, a function curve is created. A function curve, or fcurve, is a representation of the animation values as a graph in the fcurve editor.
The shape of the fcurve shows how the parameter's value changes over time.

Function curve for a bouncing ball in the fcurve editor shows its animation on its Y axis.
On the fcurve, keyframes are represented by key points (also referred to as simply keys) and the interpolation between them is represented by segments of the curve linking the key points.
The handles of each key let you define the fcurve's slope in the same way that control points define Bézier curves, while the slope of the curve determines the rate of change in the animation. For example, if the slope inclines toward a key, the animation is accelerating; a decline means a deceleration.
 Except where otherwise noted, this work is licensed under a Creative Commons Attribution-NonCommercial-ShareAlike 3.0 Unported License