When the animation editor is open with Editor  Fcurve View active (the default), it displays the fcurves of any elements you select.
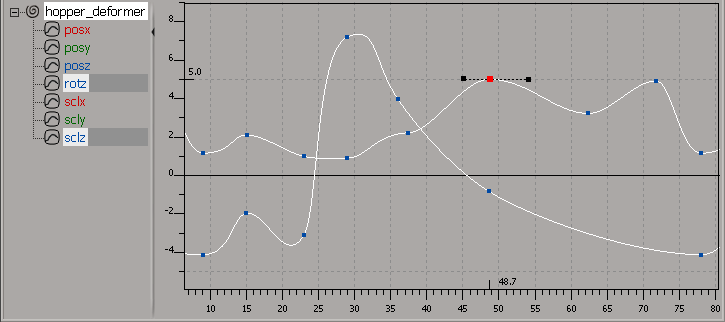
The graph in the view area is where you manipulate the fcurve of any animatable parameter. You can edit the keyframed values by adjusting the keys on a selected curve.
The graph's horizontal axis (X) displays the time scale in frames or milliseconds. The vertical axis (Y) displays the values of the animated parameter.
For information about the profile curve editor that it used in several property editors, see The Profile Curve Editor.
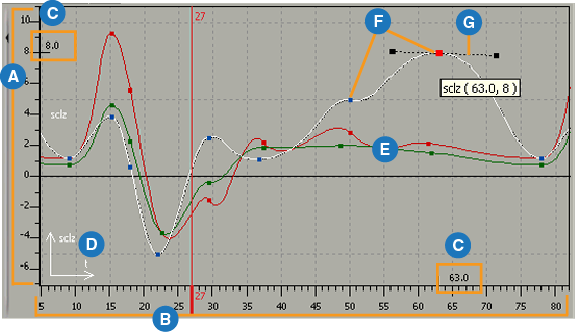
| A |
Values for the parameter are shown on the Y axis. |
| B |
Time is shown on the X axis. You can use this timeline as you would the main timeline in Softimage. See Setting Up the Fcurve Editor Graph and Timeline. |
| C |
Key coordinates indicate the exact frame number (on the X axis) and value (on the Y axis) of the most recently selected key. See Setting Up the Fcurve Editor Graph and Timeline for more information. |
| D |
Curve and axis labels indicate the type of curve and the affected axis. For example, this fcurve represents the object's rotation on the Z axis. The axis label is in the graph's lower-left corner. See Setting Up the Fcurve Editor Graph and Timeline for more information. |
| E |
Curves for X, Y, and Z parameters are red, green, and blue, respectively. For example, an fcurve for scaling in Z is blue, whereas scaling in X is red. To set custom colors for fcurves, see Using the Animation Explorer. |
| F |
Keyed values on fcurves are indicated by keys. Selected keys are red, and unselected keys match the color of their fcurve. See Setting the Default Selection Tool for more information. |
| G |
By default, fcurves use spline interpolation to calculate intermediate values. See Choosing a Function Curve Interpolation Type for more information. The slope handles at each key indicate the rate at which an fcurve's value changes. You can change the curve's slope by manipulating these handles. See Editing a Function Curve's Slope for more information. |
To determine what's displayed in the fcurve editor, you need to first determine which type of parameters to display in the animation explorer, then select which type of fcurves you want to display in the graph.
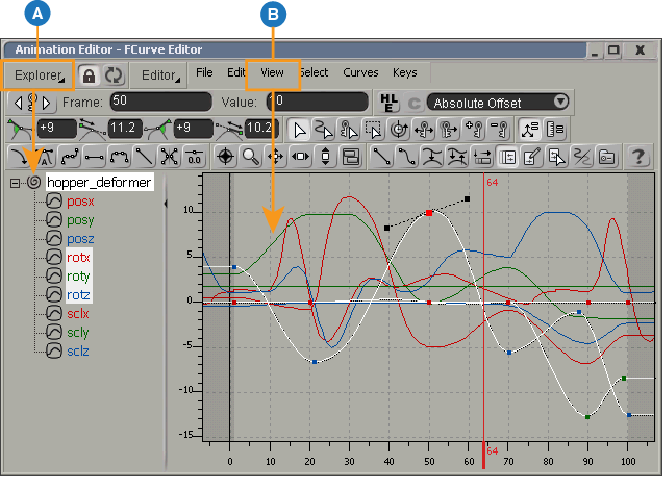
| A |
Select which parameters are displayed in the animation explorer by choosing commands from its Explorer menu, such as only animated parameters (the default), keyable parameters, custom properties, kinematics, and so on - see Choosing Which Parameters Are Displayed in the Animation Explorer. |
| B |
Then use the options in the View menu to determine which fcurves are displayed in the graph - see below. |
Only nodes that lead to a visible animated parameter are shown in the animation explorer, regardless of its Explorer menu filter type.
Children objects are shown only if the branch is selected. Root objects are always shown because they define the scope of the view.
Once you have the parameters you want shown in the animation explorer, you can control the display of fcurves in the graph with the commands in the View menu:
View All Parameters displays the fcurves of all animatable parameters for the selected object. You can also press the 6 key.
View Animated Parameters displays the fcurves of all animated parameters for the selected object. You can also click its icon in the toolbar or press
the 7 key.

View Marked Parameters displays only the fcurves of marked parameters for the selected object. You can also click its icon in the toolbar or press
the 8 key.

The marked parameters are highlighted in yellow in the animation explorer when this command is active.
View Selected Parameters displays only the fcurves of the parameters that you select in the animation explorer. You can also click this icon in the
toolbar or press the 9 key to choose this command.

When you select a parameter in the animation explorer, its fcurve is also automatically selected so that you can easily edit and manipulate it.
If you want to have the fcurves for the selected parameters be displayed but not automatically selected, deactivate the Display Allow selecting curves from the tree in Selected Mode option on the Editor page in the Fcurve Editor Preferences property editor.
To display fcurves for unanimated parameters:
Make sure that Explorer Animated Parameters Only is off in the animation explorer.
In the animation explorer, browse for and select the unanimated parameters for which you want an fcurve.
Selecting a folder (such as kine.local) displays fcurves for all unanimated parameters within it.
A flat fcurve appears for the each unanimated parameter you select. You can then add keys to this fcurve and edit it as you like.
Once you have selected a filter from the View menu (Animated Parameters, Selected Parameters, or Marked Parameters), you can isolate only the selected curves in the graph. This lets you keep your general filtering option, but focus on just one curve (or a few curves) at a time that you're editing.
Choose the View Isolate Curve command or click its icon. Only the selected fcurves appear in the graph. If you select other parameters in the animation
explorer on the left, their curves are also isolated and then displayed in the graph.

Choose this command again to turn off the Isolate Curve mode and return to the current View menu filter. The original fcurve selection before choosing the Isolate Curve command is restored.
You can hide one or more curves in the graph. Hiding curves does not remove them from the view, so any fcurve buffer information is retained and available once you display the curve again.
When you lock an element, its fcurves are always visible. You can then select other elements and still have access to the locked element's fcurves in the fcurve editor.
Click the Lock icon on the toolbar to force the selected view to stay open ("locking" it) and prevent it from updating if you select a different object. Click the button again to deactivate it (and update the animation explorer if the selection has changed).

To update to a new object while keeping the animation explorer locked, select the object and then click the Update icon. This refreshes the animation explorer contents to the currently selected object.
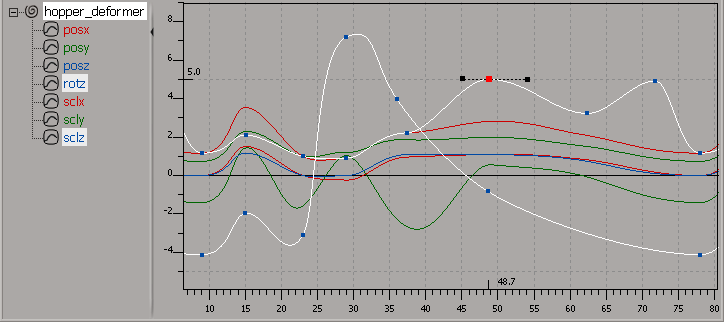
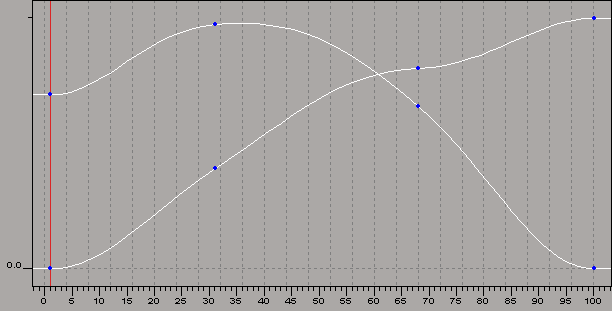
When you're working with many fcurves, it's not unusual that some curves will have varying values: one curve is too big to fit in the graph, while another is too small to see clearly. By "normalizing" the graph's Y axis, you can easily view multiple curves that have a broad range of values. Normalizing scales all selected curves so that they fit in the graph, regardless of their unit scale.
Choose View Normalized in Y (Value) from the fcurve editor toolbar to activate it. To return to the default linear scale, choose it again.
For example, let's say you have one curve that spans values between 0 and 5, and another curve whose values range between 0 and 400. Viewing both of them on a standard scale would make the first curve very difficult to work with.
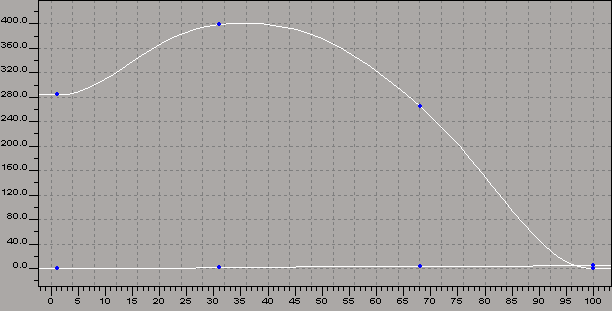
Normalizing the Y axis lets you view the full range of each curve (you view 0 to 100% of its Y value).
When you choose View Metacurve Region, a bar below the graph shows a "dopesheet-like" view called a metacurve. This gives you an overview representation of all
the keys on the selected fcurves in the graph. If the selection changes, it updates to reflect the new selection.
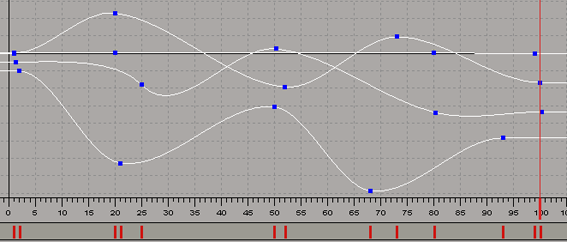
Metacurve region below the graph shows an overview of key positions for all selected fcurves.
The vertical bars, called metakeys, show where corresponding keys are located on the fcurves. When you move a metakey, it displaces all the corresponding keys on the corresponding curves.
On the View page, select Active in the Interactive Update section. You can adjust the Speed of the update by entering a value.
At the top of the View page, you can also determine the level of control when moving keys by setting the Interaction Lag value. The default is the mouse moving 1 pixel before interaction starts.
If you have created action sources from fcurves, you can see the corresponding time of the animation between the action in the animation mixer and the fcurve editor.
You can select an action clip in the mixer and choose View Local Time in the fcurve editor. You'll see that the playback cursor in the fcurve editor shows the local time of where the original
action source is being evaluated, and the playback cursor in the mixer shows where this point is in relation to the global
time of the scene.
You can also choose Explorer Driving Actions at Curr Time in the animation explorer to display parameters that are driven by an action clip in the animation mixer at the current frame
(the playback cursor is at a frame that is covered by an action clip). Only the fcurves for the selected object's current
clip are displayed in the fcurve graph.
For more information on action sources and the fcurve editor, see Modifying Action Sources.
 Except where otherwise noted, this work is licensed under a Creative Commons Attribution-NonCommercial-ShareAlike 3.0 Unported License