Editor | View | Keys | Curve Processing | Paste Options | Audio | Retime Tool
Sets the preferences for controlling the fcurve editor's appearance and function, as well as allowing you to set options for
editing function curves.
To display, do one of the following:
-
Choose from the main menu bar, then click the icon or node in the explorer on the left of the Preferences property editor.
-
Choose in the fcurve editor command bar.
-
Click the Preferences icon in the fcurve editor command bar.
You can determine the default function curve style, interpolation, and slope attributes using the options in the Animation Preferences. These settings are used when you create function curves by setting keys.
Editor
Controls various settings of the fcurve editor, including fcurve display options, how the grid is displayed, and how the clipboard
is managed.
For more information, see Setting Up the Fcurve Editor Graph and Timeline.
Display
|
|
Determines which fcurves are displayed in the graph by default:
-
displays no fcurves for the selected object.
-
displays fcurves for all parameters of the selected object.
-
displays fcurves only for the object's animated parameters.
-
displays fcurves only for the object's marked parameters.
-
displays fcurves only for the object's selected parameters.
|
|
|
When the command is active in the fcurve editor and you select a parameter in the animation explorer, its fcurve is also automatically
selected. This makes it easy to edit and manipulate the fcurve immediately.
Deselect this option if you want to display the fcurves, but not select them, when you select a parameter in the animation
explorer.
|
|
|
Toggles the option in the fcurve editor which switches fcurve editor modes:
- : This mode is on by default and provides all the tools that you are used to if you are a seasoned Softimage user. It is the
same as in previous versions of Softimage.
- : When the Classic Mode option is off, the Suite mode is active. This mode is designed to be used if you're running the Suite
version of Softimage. It displays a simplified set of icons on the command bar, similar to other Autodesk 3D applications,
and provides the same context (right-click) menu no matter what you click on in the fcurve graph.
|
Grids
Control the properties of the grid displayed in the fcurve graph. You can set the properties for the horizontal and vertical
directions separately.
|
|
Sets the spacing between grid lines on the X (Time) and Y (Value) axes. displays or hides the X and Y axis grid lines.
|
|
|
Sets the interval on the grid's X (Time) and Y (Value) axes to which a key will snap when it is moved or created. toggles the snap-to-grid feature on and off.
|
|
|
Sets the in Softimage units or the in degrees to which slope handles on key points will snap when manipulated. toggles this option on and off.
|
Rulers
Sets the spacing between ruler increments on the X (Time) and Y (Value) axes for the fcurve graph. The units displayed on
the ruler are the same as the units you choose for the current Time Display. Use the Time preferences to choose units of frames,
seconds, or milliseconds.
|
|
displays or hides the rulers on the horizontal X (time) and vertical Y (values) axes.
|
Default Tool
Sets the default selection and editing tool to use in the fcurve graph.
|
|
Selects and moves function curves, keys, and slope handles.
|
|
|
Selects only function curves.
|
|
|
Selects only keys.
|
|
|
Selects and moves keys.
|
Custom Commands
|
|
Softimage does not automatically scan the Fcurve Editor's Edit menu for existing plug-ins. If you do want to scan for plug-ins,
select this option.
|
View
|
|
The number of pixels a mouse moves before interaction begins. You can decide on how fine you want the control when moving
points and slope handles on key points.
|
View
Controls how various elements appear in the fcurve editor.
|
|
Displays the X and Y coordinate values for each selected key.
|
|
|
Displays the slope handles of all points on a selected function curve. When off, only the slope handles of selected keys are
displayed.
|
|
|
Displays the keys of all displayed function curves. When off, only the keys of selected function curves are displayed.
|
|
|
Toggles the option in the fcurve editor. This option displays a temporary copy of the original function curve that has been saved into
a buffer.
See Editing Safely with Function Curve Buffers for more information.
|
|
|
Choose either the Pan & Zoom or Zoom (rectangular selection) tool to be the default zoom mode.
|
|
|
Toggles the display of the red playback cursor in the animation editor.
|
|
|
Toggles the selectability of the red playback cursor only in the fcurve graph. The playback cursor is always available in
the animation editor's timeline, if visible.
|
|
|
Toggles the option in the fcurve editor. This option automatically frames an object's fcurves in the graph when you open the animation
editor or when you update the selection.
If you have the filter active for the fcurve graph and you select one or more parameters in the animation explorer, their fcurves are automatically
framed in the graph.
|
Interactive Update
|
|
Toggles the command in the fcurve editor and controls its refresh speed.
|
Keys
Controls how keys are manipulated in the fcurve editor.
|
|
The slope angle text boxes in the fcurve editor command bar display the handle values as a ratio of Y values over X values.
|
|
|
Does as advertised! When you select keys on a curve and select either spline or linear as the interpolation type, the same
interpolation is used on the slopes on both sides of the keys.
|
To set other options for selected keys, see the Key Properties Editor.
Curve Processing
Contains settings that control how function curves are recalculated during Resample, Smooth, and Fit operations.
Set the options on this page, then select the appropriate command from the menu in the fcurve editor command bar: , , or .
For more information, see Cleaning Up Function Curves (Curve Processing).
Resample
Generates a function curve with keys at specific intervals.
|
|
Specifies at what interval keys will be inserted when using the resampling option.
|
|
|
Keep keys that existed before adding keys through the resampling option.
|
Smooth
Removes sharp spikes and jags from a function curve by averaging between keys.
|
|
Smooths the function curve by applying a moving average. The weights of the averages are uniformly distributed.
|
|
|
Smooths the function curve by applying a moving average. The weights of the averages are distributed as a bell curve. This
usually gives better results than the average filter.
|
|
|
Defines the number of keys that are averaged to calculate a new key. A high filter size will yield a much straighter curve.
|
|
|
For the Gaussian filter only. Controls the degree of smoothing. A higher variance smooths the function curve more.
|
Simplify
Removes redundant keys while preserving the original shape of a function curve.
|
|
Adjusts the closeness of the fit. Smaller values will respect the original shape of the curve more by using more keys, while
larger values will use less keys and result in a fit that deviates from the original curve.
|
|
|
Resamples the curve before the fit is applied using the value set for the - . This is useful for fitting on low-density fcurves.
|
Paste Options
Controls how cut or copied keys are pasted onto function curves.
For more information, see Cutting, Copying, and Pasting Keys and Function Curves.
Paste Options
The paste options determine how the copied or cut keys will be pasted on the function curve.
|
|
Existing keys on the function curve will be pushed to the right on the timeline after the insertion point of the pasted keys.
Selecting this option is the same as clicking the Ripple icon or choosing in the fcurve editor command bar.

|
|
|
Determines whether the pasted keys will merge with or replace existing keys on the fcurve:
|
|
|
Determines the value of the pasted keys:
|
|
|
Allows you to cut or copy and paste fcurves and keys across multiple instances of Softimage. However, you can cut/copy and
paste from only one fcurve at a time.
|
Continuity Options
Controls how new keys are integrated into the pasted area. The Left Key and Right Key settings specify which values will be
used in calculating the key points to be inserted at the left and right of the paste region.
Left Key
Specifies which values will be used in calculating the key points to be inserted at the left of the paste region.
|
|
Inserts a key at the left of the paste region by taking an average of the values of the copied and original curves at that
point.
|
|
|
Inserts a key at the left of the paste region by using the value of the original curve at that point.
|
|
|
Inserts a key at the left of the paste region by using the value of the copied curve at that point.
|
Right Key
Specify which values will be used in calculating the key points to be inserted at the right of the paste region.
|
|
Inserts a key at the right of the paste region by taking an average of the values of the copied and original curves at that
point.
|
|
|
Inserts a key at the right of the paste region by using the value of the copied curve at that point.
|
|
|
Inserts a key at the right of the paste region by using the value of the original curve at that point.
|
Audio
Sets options for audio waveforms displayed in the background of the fcurve graph.
To display the waveform in the fcurve graph, drag and drop an audio clip from the animation mixer or explorer, or drag and
drop an audio source or file from an explorer or browser into the fcurve graph.
For more information, see Viewing Audio Waveforms.
Audio Waveform
|
|
Toggles the display of the waveform in the graph.
|
|
|
Determines how much of the fcurve graph area the waveform covers. The waveform is always drawn starting from the upper-left
corner of the graph.
By default, the waveform is displayed using 100% of the fcurve graph. If you change the amount of display area to take up,
say 50%, the waveform is drawn at half the original height, but also shifts up in the graph.
|
|
|
Shows the full path of the current audio clip being displayed (such as Mixer.Mixer_Audio_Track.Clip). You can enter a new path or delete this field to clear the audio clip.
|
Markers
|
|
Toggles the display of any markers associated with the audio clip. The marker display level is also taken into account and
displayed accordingly.
These markers are for display purposes only, so you cannot select or move them.
|
|
|
Determines the limit of how high the smallest level of markers is drawn. The lower the value, the higher up in the graph they
are displayed.
|
|
|
Determines the limit for how low the largest level of markers is drawn. The higher the value, the lower down in the graph
they are displayed.
|
|
|
Toggles the display of the marker's value at the bottom of the marker. These values are any labels you have added to the marker
to identify it. Values are set in the marker's Marker property editor.
|
|
|
Toggles the display of the marker's duration in frames. The duration appears as a gray box on the marker covering the appropriate
number of frames.
|
Retime Tool
Sets the default behavior for the Retime Keys tool.
For more information, see Retiming Animation on Function Curves.
|
|
Toggles the snapping of the retime markers to the closest frame when both creating and moving retime markers. With this option on, you can still temporarily deactivate snapping by pressing Shift as you drag the retime markers.
|
|
|
Toggles the clearing of the current retime markers when you exit the Retime Keys tool. When this option is off, the retime markers that were displayed when you exited the tool are remembered the next time you
activate the Retime Keys tool.
|
Colors
Sets the color used for the different parts and states of the Retime Keys tool.
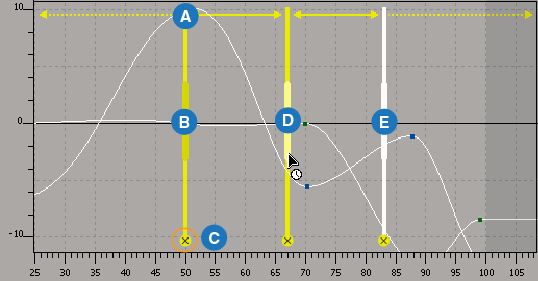
|
|
Sets the color for the:
|
|
|
Sets the highlight color when you move the mouse over any part of an unselected retime marker:
|
|
|
Sets the color for the selected retime marker:
- (E) includes the retime marker bar and handle.
- (not shown) is the highlight color when you move the mouse over any part of a selected retime marker.
|
 Preferences from the main menu bar, then click the Editors
 Except where otherwise noted, this work is licensed under a Creative Commons Attribution-NonCommercial-ShareAlike 3.0 Unported License


