


Shows the amount of curvature at sample points along the curve, as well as other qualitative measures of the curve.
Add a curvature comb to a curve
 .
.
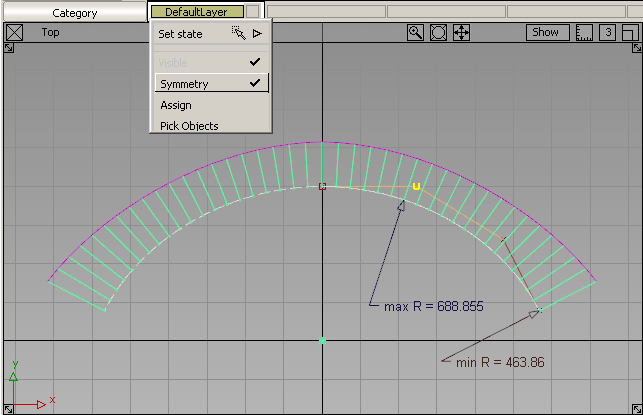
The curvature combs appear on the selected curves.
If the curves are on a layer that has Symmetry turned on, the combs appear on the symmetric geometry as well. If Min Max Radius labels are turned on, they only appear on the original geometry.
 to change the scale of the quills.
 to change the sampling density of the comb.
❒.
to change the sampling density of the comb.
❒.
Choose Preferences > Performance Options . In the Expression Updates section, turn on During Transform.
There are many ways you can modify a curve when you are trying to fix curvature problems:
Choose Windows > Information > Information Window and change the color ranges so that the values you are looking for are drawn in one color.
See View or change the properties of objects and locators.
See also Edit a label or measurement object.
Create cross sections on the surface, and turn on the curvatureplot,through the Cross Section Editor. (See Create or view cross sections for more information.)
Choose Windows > Information > Information Window and use the Plot Value option to change what the comb plot measures.
See View or change the properties of objects and locators.
See also Edit a label or measurement object.