When you first open the Node Editor, it graphs the selected objects in your scene view.
To graph the node network of your choice, see the following sections.
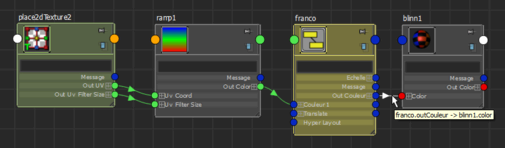
To display node connections, do as follows:
 icon in the Node Editor toolbar to display the input and output node connections.
For a legend of what each connection color represents, see Connection colors in the Node Editor.
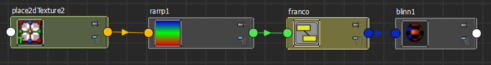
 ,
,  , and icons. For more information about view modes, see Changing view mode for nodes.
To display the attribute connections between nodes, do as follows:
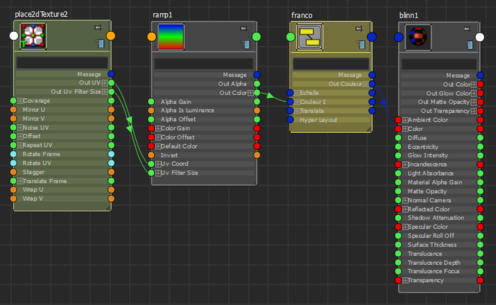
The attributes for each node are ordered as follows:
You can graph the shading network for the object(s) selected in the scene view.
 on any empty area in the Node Editor to access the work area marking menu and select Graph Materials on Viewport Selection.
 Except where otherwise noted, this work is licensed under a Creative Commons Attribution-NonCommercial-ShareAlike 3.0 Unported License


 icon on the toolbar to expand each node to its full mode.