Chapter 20, Color Correction
| Color Correcting with CC Basics | Clamp Color Tool | ||
Chapter 20, Color Correction |
|||
The Histogram controls help you visualize how the individual pixel RGB values are distributed across the image.
The histogram is a visual representation of all the color values contained in the image as they are distributed over the range of pixel values (0-255). The color values depend on the bit depth (255 is the highest value for 8-bit).
You can view histograms for the red, green, or blue channels, or you can view the histogram for the entire image (RGB).
Note: If vertical lines are too small to be viewed, you can zoom in by placing the cursor in the histogram viewer and then using the Up arrow and Down arrow keys.

The Color Correct Histogram UI displays the input and output level adjustments for the selected tonal range and channel, as well as the histogram for the selected channel. The Ranges tab also displays the histogram for the selected channel, as well as the Shadows, Midtones, and Highlights curves.
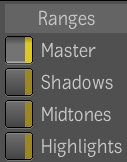
The four Tonal Ranges selectors select the tonal range to operate on, namely Master (all pixels), Shadows, Midtones, and Highlights.
 "Show full-size image")
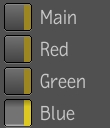
The four channel selectors select the channel to operate on, namely luminance labelled Main, Red, Green, and Blue.
 "Show full-size image")
There is one set of input and output levels adjustments for each channel of each tonal range for a total of sixteen sets of input and output levels adjustments.
 "Show full-size image")
|
|
Note: The CC Histogram's input and output level controls' fields are animatable attributes--see Setting Keys Manually and Validating and Applying the Expression String.
The Input sliders below the histogram viewer are used to control the range of input color values in the image. The white slider on the right sets the maximum value for the range. The black slider on the left sets the minimum value for the range.
The histogram shown in the main tab is that of the selected channel creating a total of four possible histograms. The histogram background color matches that of the selected channel: gray for luminance, red, green, or blue.
All main tab values are shown in the range [0 to 1].
The input slider controls the values that are clamped to 0 (below the minimum) and to 1 (above the maximum). Values in between are scaled from 0 to 1. You can also use this to increase contrast.
You can set the maximum and minimum limits for the color range by entering the values in the Input fields on either side of the histogram.
Note: Input levels increase contrast (remap more grays to blacks and whites), while output levels decrease contrast (remap more blacks and whites to grays). If you have an image that requires some softening of color or tone, the output levels re-introduce some midtones to the image.
From the Tools tab, drag the CC Histogram tool from the Color Correction folder to the dependency graph in the Schematic view.
Select Master, Shadows, Midtones, or Highlights to select the areas of the image that you want to modify.
Select Main, Red, Green, or Blue to select the channel that you want to work with.
Do one of the following:
Position the cursor on the black slider below the histogram. Set the level until the value that you want to use as the lower limit for the color range appears in the Minimum field.
This darkens the shadow areas.
Position the cursor on the white slider below the histogram. Set the level until the value that you want to use as the upper limit for the color range appears in the Maximum field.
The brightness in the highlight areas increases.
To cancel the changes, select Reset in Tools Options.
The sliders on the Output levels bar below the histogram contain the Output level controls. Use these controls to set the range of colors in the image.
The white slider on the right sets the maximum value for the range. The black slider on the left sets the minimum value for the range.
The Output slider remaps pixel values produced by the input level. Values at 0 are remapped to the minimum, values at 1 are remapped to the maximum, and values in between are linearly interpolated. The output slider background is a linear ramp of the same color as the selected channel: gray, red, green, or blue.
You can also set the maximum and minimum limits for the color range by entering the values in the Output fields on either side of the histogram.
From the Tools tab, drag the CC Histogram from the Color Correction folder to the dependency graph in the Schematic view.
Select Master, Shadows, Midtones, or Highlights to select the areas of the image you want to modify.
Select Main, Red, Green, or Blue to select the channel that you want to work with.
Do one of the following:
Position the cursor on the black slider below the Output levels bar. Set the level until the value that you want to use as the lower limit for the color range appears in the Minimum field.
The shadow areas are lightened.
Position the cursor on the white slider below the Output levels bar. Set the level until the value that you want to use as the upper limit for the color range appears in the Maximum field.
The brightness in the highlight areas is decreased.
To cancel the changes, select Reset in Tools Options.
When using a CC Basics or CC Histo tool, you can redefine what constitutes a shadow, midtone, or highlight.
 "Show full-size image")
|
|
|
Select the Ranges tab.
Select a Display parameter from the drop-down menu.
Drag the tangent handle connected to the curve you have selected to modify.
Open the CC Basics UI.
Under Balance, adjust the Hue and Gain to set the color balance for each of the Shadow, Midtone, and Highlight ranges.
Go back to the Ranges controls and set the curves.
Go back to the CC Basics controls. Without changing the color balance setup, note that the resulting image is different from that in step 1.
The difference is the result of the changes that were made to the curves of the shadows, midtones, and highlights.
