Learning Resources > Tutorials > Getting Started with Maya > Fluid Effects > Lesson 3: Creating a dynamic
3D effect >
Painting Fuel and Density
into a container
In Fluid Effects, Fuel defines the state of a reaction (unreacted, completely reacted, and states in between). Density represents the substance that is reacting, while Temperature causes the reaction. Combining Density with Fuel defines a situation in which you can see a reaction. You add Temperature to this situation to start the reaction. As the reaction takes place, Density values become smaller and the Fuel values get smaller to represent how much of the reaction has yet to take place. The reaction also creates more Temperature, and it creates light.
In the following steps you’ll paint Fuel and Density values in the container. To paint in a 3D container you actually paint in two dimensions on “slices” of the container. A slice is a plane in X, Y, or Z that represents where you paint. (You could think of a slice as a 2D canvas.) You paint each slice individually, but the accumulative effect of adjacent slices is a 3D fluid.
To paint Fuel and Density into a container
 .
.
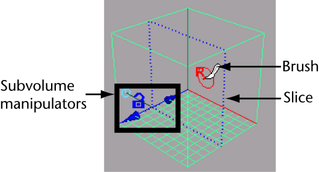
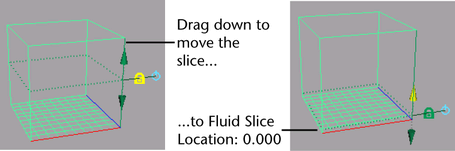
The Tool Settings window opens and a slice displays at the origin of the fluid container. The slice is represented by a plane with dotted edges and fluid subvolume manipulators at one corner. When you move the pointer over the slice the pointer changes to a brush indicating that you can paint.
You could paint each property separately, but for this example, the values you paint will be the same for both. It is more efficient to paint them both at the same time.
A message appears prompting you to set the fluid’s Fuel method to Dynamic Grid. By setting the Fuel method to Dynamic Grid, the fuel values you place in the container grid (in this case, by painting them) are recalculated by the fluid dynamics solver and changed during simulation. The Density method is defined as Dynamic Grid by default.
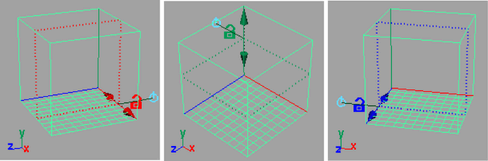
The orientation of the slice changes relative to your view. The slice is perpendicular to the axis with the manipulators. The color of the manipulators corresponds with the color of the axis in the View or Origin axes.
Painting properties relative to different axes is good practice to ensure there are no gaps between slices when the fluid is viewed from different angles.
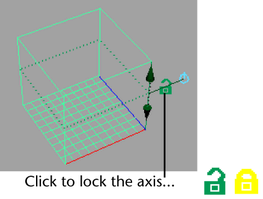
The lock closes. Now when you tumble, the slice remains perpendicular to Y. It does not switch to the other axes. This allows you to change the view in any way and still be able to paint on the same slice.
The help line displays the location of the selected slice.
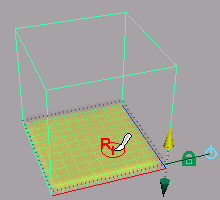
The values display as yellow because you are painting two properties at the same time. Density values are represented by the opacity of the shaded values, while Fuel values are represented by color. The range of Fuel values corresponds with a ramp of colors from blue (values of 0) to yellow (values of 1).
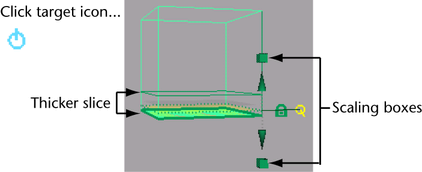
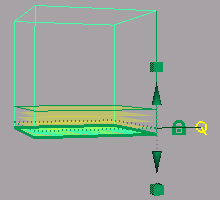
To make the fluid deeper, you could move the slice to Fluid Slice Position 1, paint, move the slice to Fluid Slice Position 2, paint, and so on. But a quicker way is to resize the slice to make it thicker and then flood the entire slice with values.
The slice becomes thicker and the manipulator changes to include scaling boxes at the ends of the move arrows.
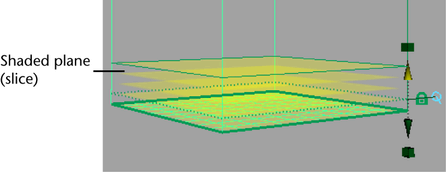
Flooding filled each voxel in the subvolume with Fuel and Density values of 1.
Notice that the values display as shaded planes rather than as a solid mass. This is an interactive display feature for shaded display mode. Displaying more shaded planes (slices) produces more detail but reduces the speed of the screen draw. You can change this display feature (Slices Per Voxel) and others in the Display section of the Attribute Editor.
Now that the container has Density and Fuel in it, you are ready to start a reaction by adding Temperature. You could think of this as putting a lit match into a container of gasoline.