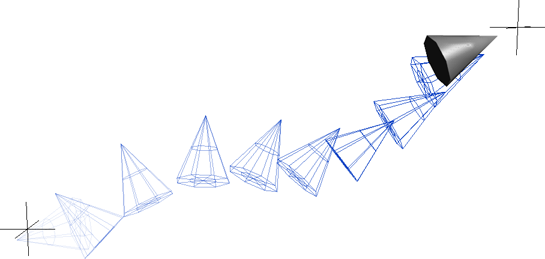
Plotting animation "bakes" together any kind of animation information on a parameter into a single function curve. When you plot the animation on an object, the animation is evaluated frame by frame and function curves are created.
Plotting is useful when you want to bring different types of animation together into one source, and for exporting animation. You can, for example, plot the animation of a constrained object and then remove the constraints so that only the plotted animation remains on the object.

The animation of an object constrained between two points is plotted so that fcurves are created, which can then be edited.
You can choose the type of function curve you want to create when you plot the animation: standard (with different types of interpolation), raw, Boolean, or integer.
In addition to plotting general animation, you can also:
Cache an object's animated deformations or simulation data to a cache file — see Writing Cache Files.
Plot shape animation — see Sharing Shape Animation between Objects, Models, and Scenes).
Plot a curve from an object's animated transformation values — see Creating a Curve by Plotting an Object's Transformation).
Plotting is done by first creating an action source (see Action Sources and Clips for information). Depending on the settings you select in the Plot dialog box, you can choose to keep or delete this action source after the animation is plotted:
You can apply the plot function curves immediately to the object and delete the action source.
You can apply the plot function curves to the object and also keep them stored in an action source. This may be useful if you're using the animation mixer.
You can keep the action source of the plotted function curves but not have it applied to the object immediately. You must
then select the source and apply it to the object using the Actions  Apply
Apply  Action command (see Restoring (Applying) the Animation in Action Sources to an Object).
You can then load the action source into the animation mixer to make a clip of it, as you would for any other action source.
If you're using action sources in the animation mixer, you can use plotting to "bake" animation from any combination of sources (including other action clips) into a single action source. For example, you can combine the animation of a walk cycle and an arm waving into a single action clip by plotting instead of creating a compound clip.
While the process of plotting is fairly straightforward, here are a few tips to make sure that you're plotting what you want.
If you branch-select an object, animation will not be plotted for its children. This is unlike storing actions, which automatically expands the branch selection; rather, it is similar to saving keys that work only on the root of the selection.
To plot the animation of an object's children as well, branch-select the object and then choose Select  Select Child Nodes.
If you are not plotting local transformations of any type or constrained parameters, make sure to mark the parameters whose animation or
values are to be plotted and then choose the Plot  Marked Parameters command.
For example, if you want to plot an object's global transformation parameters, you must mark them first and then choose this command. You can also create a marking set for the object with the appropriate parameters in them and then plot with this command.
For more information, see Marking Parameters for Animation.
You can plot any type of animation on an object or model, including objects that are in different models.
Select one or more objects or a model whose animation you want to plot.
To plot the animation of an object's children as well, branch-select the object and then choose Select  Select Child Nodes.
From the Tools  Plot menu of the Animate toolbar, choose the appropriate command for the type of animation you want to plot:
All Transformations plots only the local transformation (scaling, rotation, and translation) parameters. All local transformation parameters are plotted, whether they are animated or not.
Shearing and SRT plots the local transformation parameters (scaling, rotation, and translation) plus the Scaling Orientation (Shear) parameter. This is useful to plot when there is shearing information on objects imported from other 3D software.
Rotations plots only the local rotation (orientation) parameters.
Positions plots only the local position (translation) parameters.
Marked Parameters plots only the parameters that you have marked.
Keyable Parameters plots only the parameters which have been set as keyable in the keying panel.
Constrained Transforms plots only transformation parameters that are affected by constraints (for example, if a direction constraint is applied to an object, only its rotation parameters would be plotted). Only active constraints are plotted.
When the plotting is finished, a message box opens displaying the list of constraints that were plotted. You can then choose to remove these constraints from the object so that you are left with only the plotted animation.
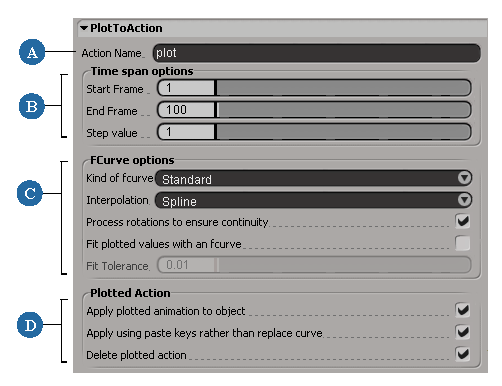
In the Plot dialog box, specify the following information:

| A |
Enter the Action Name for the new action source that will be created. This only applies if you are going to keep the resulting action source (deselect the Delete plotted action option). |
| B |
|
| C |
Select the type of fcurve to be plotted and how you want to process rotations — see Fcurve Options. If you plan to do curve fitting, it's best to create standard Spline curves. |
| D |
Choose what to do with the resulting plotted animation and action source — see Plotted Action. |
Click OK to create the plotted function curves for the animation.
If you chose Plot  Constrained Transforms, a message box opens displaying the list of constraints that were plotted. You can then choose to remove these constraints
from the object so that you are left with only the plotted animation.
 Except where otherwise noted, this work is licensed under a Creative Commons Attribution-NonCommercial-ShareAlike 3.0 Unported License