There are many different options for setting up the fcurve editor's graph and timeline to your liking.
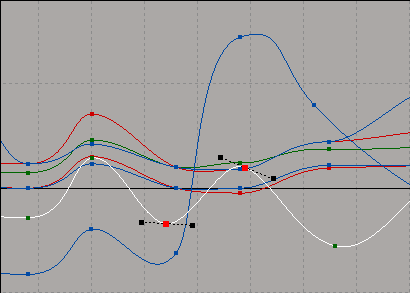
When the animation editor is open with Editor  Fcurve View active, it displays the fcurves of any elements you select.
The graph in the view area is where fcurves are displayed and edited. You can set up the graph to display and set up the grid and axis element as you like.
Setting the Time Format (X Axis)
The graph's horizontal axis (X) displays the time scale in frames or milliseconds, while the vertical axis (Y) displays the values of the animated parameter.
Setting the main timeline's format also sets the format for the timeline in the animation editor, as well as the dopesheet and the animation mixer. See Setting the Timeline Display Format for more information on how to set the animation editor's timeline.
Setting the Graph's Grid and Rulers
To show or hide the grid, do either of the following:
To show or hide only the X-axis or Y-axis grid lines:
On the Editor page in the Fcurve Editor Preferences editor, select Display Grid  Show for the X and/or Y axes.
To set the size of units for the grid:
To show or hide the axes rulers:
You can display or hide both the X and Y axes (the numerical values) of the graph by choosing View  Rulers from the toolbar.
To show or hide only the X-axis or Y-axis rulers:
Hiding and Displaying Fcurve Information
You can choose to view extra curve, key, and slope information while you're working in the graph. However, if you have many fcurves displayed in your graph, you may want to hide a certain amount of curve information to keep the view uncluttered.
To hide or display curve information:
From the toolbar, choose any or all of the following:
View  Keys on Unselected Curves to show or hide keys on all unselected curves in the graph. If you choose this command, you can select keys without having
to first select the fcurve.
If you don't choose this command, you must select an fcurve before being able to select keys on it. This prevents you from accidentally manipulating keys, which can be a problem if there are many curves and keys.
You can set the default for this option's state (on or off) on the View page in the Fcurve Editor Preferences property editor.

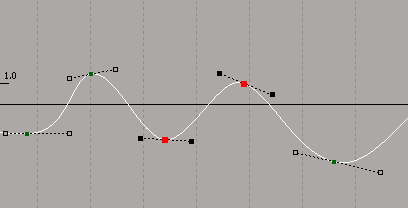
View  Slopes on Unselected Curves to show or hide the slope handles of all unselected keys on a selected curve.
You can set the default for this option's state (on or off) on the View page in the Fcurve Editor Preferences property editor.

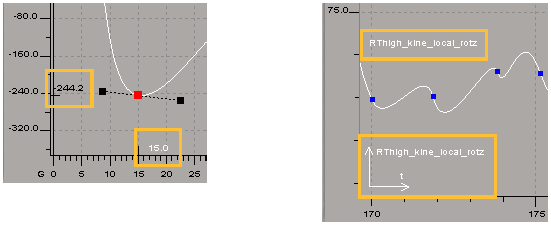
View  Keys Coordinates to show or hide the current time and value of a selected key.
You can set the default for this option's state (on or off) on the View page in the Fcurve Editor Preferences property editor.
View  Curve and Axis Labels to show or hide labels on all selected curves in the graph. Because fcurves for expressions and linked parameters do not
necessarily use the same horizontal time units as other curves, selecting Curve and Axis Labels helps you to know the meaning of their values.

On the left, the key's Y (value) and X (time) coordinates shown for last selected key.
Using the Fcurve Editor's Timeline
By default, the red playback cursor is displayed in the animation editor's timeline and over the view area. This lets you easily scrub through the animation and go to the exact frame you want.
As well, you can see and move loop markers in the animation editor's timeline when you click the Loop button in the playback
panel. 
Drag the red playback cursor to move frames. You can also drag the yellow loop markers to change the looping range.
To set a preference for displaying the playback cursor :
On the View page, toggle the Time Cursor Visible option. This setting controls all time-related cursors in the animation editor (current frame, key time, etc.).
Toggling the command in either the View menu or the Fcurve Editor Preferences editor changes its state in the other.
By default, you can drag the cursor in the timeline area but not in the fcurve graph area. However, you can change the behavior so that you can also select and drag the playback cursor in the graph area.
Note that the playback cursor is always available in the timeline area, as long as it's visible.
To make the playback cursor available in the graph:
To set a preference for making the playback cursor available:
On the View page, toggle the Time Cursor Selectable option.
Toggling the command in either the View menu or the Fcurve Editor Preferences editor changes its state in the other.
To copy key values to another frame:
Middle-click+drag the cursor in the animation editor's timeline to copy key values from one frame to another, just like you do in the main timeline (see Keying the Current Values at a Different Frame).