You can freeze a key's values as well as its location in time by locking the key's position on the graph's X and Y axis.
If the fcurve uses spline interpolation to calculate the transition to the next key, you can also freeze the key's speed of transition and influence on the fcurve via the fcurve editor's slope handle locking controls. For more information, see Editing a Function Curve's Slope.
Select the keys whose values or locations in time you want to freeze.
Do one or both of the following:
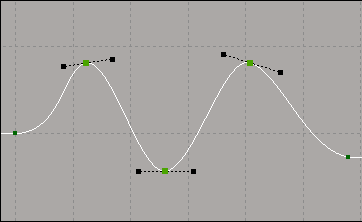
Choose Keys  Lock in X (Time) to lock the keys' location in time on the X axis. The keys turn bright green.

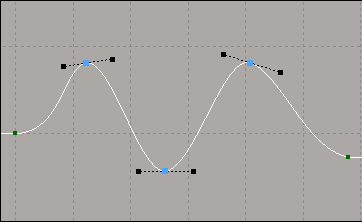
Choose Keys Lock in Y (Value) to lock the keys' value on the Y axis. The keys turn blue.
If they keys are locked in both X and Y, they turn a darker green.
The key is frozen in place on the graph and cannot move in the locked axis. You can, however, still manipulate the key slope handles to change the shape of the slope, unless the handles have also been locked (see Locking Slope Handles).


