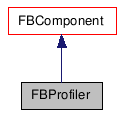
FBProfiler Class Reference
Detailed Description
Central place to query profiling results and change profiling options.

Public Member Functions |
|
| __init__ (object pObject=None) | |
| Constructor. |
|
| int | GetEventSampleCount () |
| Get number of time event samples collected
during last sampling. |
|
| HFBProfileTimeEvent | GetEventSample (int pIndex) |
| Only possible way to query collected
FBProfileTimeEvent. |
|
| HFBProfileTimeEvent | GetEndEventSample (int pIndex) |
| Get end time event for event at given index.
|
|
| int | GetStatCount () |
| Stats are holding last execution
time/duration of action. |
|
| int | GetStatIndex (str pName) |
| Search for index of given stat name.
|
|
| str | GetStatName (int pIndex) |
| Get information about what action is stat
refering to. |
|
| str | GetStatComment (int pIndex) |
| Get aditional information about what action
is stat refering to. |
|
| float | GetStatDuration (int pIndex) |
| Get time that was spend on execution of
action. |
|
| float | GetProfilingCost () |
| Profiling collection can affect scene
performace. |
|
| int | RegisterTaskCycle (str pUniqueName, float pColor=None) |
| Register a new task cycle for profiling.
|
|
| bool | IsTaskCycleNameRegistered (str pName) |
| Test to see if a task cycle is already
registered based on the name provided. |
|
| FBProfiler | TheOne () |
| Get the global object for this class.
|
|
Public Attributes |
|
| FBPropertyProfilingMode | ProfilingMode |
| Read/Write Property: Profiling
collection modes, including disabling all profiling. |
|
| FBPropertyBase | EvaluationDepth |
| Read/Write Property: Specify the
depth of evaluation profiling for data collection (maximum value is
10). |
|
| FBPropertyBase | BufferSize |
| Read/Write Property: Buffer size for
average and timing computation (maximum value 200). |
|
| FBPropertyBase | FrameReference |
| Read/Write Property: Draw task cycles
in relation to main thread cycle time - frame cycle (percentage
display). |
|
| FBPropertyBase | ActiveSampling |
| Read/Write Property: Activate the
sampling for time events. |
|
Member Function Documentation
| __init__ | ( | object | pObject = None |
) |
| int GetEventSampleCount | ( | ) |
Get number of time event samples collected during last sampling.
- Returns:
- Number of FBProfileTimeEvent samples gathered during sampling.
| HFBProfileTimeEvent GetEventSample | ( | int | pIndex | ) |
Only possible way to query collected FBProfileTimeEvent.
- Parameters:
-
pIndex Sample index.
- Returns:
- Sample object.
| HFBProfileTimeEvent GetEndEventSample | ( | int | pIndex | ) |
Get end time event for event at given index.
This function and FBProfileTimeEvent.IsSingleEvent are useful to identify duration of event action.
- Parameters:
-
pIndex Sample index.
- Returns:
- Sample object if sample at given index is start sample.
| int GetStatCount | ( | ) |
Stats are holding last execution time/duration of action.
They are used for actions that doesn't appear frequently, like file IO.
- Returns:
- Stats count. They are created when stat occurs, so open or save action needs to be done first to get any information stored in stats.
Search for index of given stat name.
- Parameters:
-
pName Name of the sample that we are looking for.
- Returns:
- Stat index if found, -1 if not in the list.
Get information about what action is stat refering to.
- Parameters:
-
pIndex Index of stat.
- Returns:
- Stat name.
Get aditional information about what action is stat refering to.
- Parameters:
-
pIndex Index of stat.
- Returns:
- Stat comment.
Get time that was spend on execution of action.
- Parameters:
-
pIndex Index of stat.
- Returns:
- Stat duration (in seconds).
| float GetProfilingCost | ( | ) |
Profiling collection can affect scene performace.
This function return how costly is profiling.
- Returns:
- Cost of profiling the scene. (in mini seconds)
Register a new task cycle for profiling.
Pointer to name needs to stay valid during whole application session.
- Parameters:
-
pUniqueName Unique name for new task cycle pColor Color for new task cycle. Used in Profiling Center for drawing.
- Returns:
- Index of task cycle. Will return -1 if failed. If task cycle is already registered it will return its index.
Test to see if a task cycle is already registered based on the name provided.
Can also be used to verify if a name is free to be used, this included checking any conflicts with internal names.
- Parameters:
-
pName Task cycle name to test
- Returns:
- True when name is used. False when name is not used.
| FBProfiler TheOne | ( | ) |
Member Data Documentation
| FBPropertyProfilingMode ProfilingMode |
Read/Write Property: Profiling collection modes, including disabling all profiling.
| FBPropertyBase EvaluationDepth |
Read/Write Property: Specify the depth of evaluation profiling for data collection (maximum value is 10).
| FBPropertyBase BufferSize |
Read/Write Property: Buffer size for average and timing computation (maximum value 200).
| FBPropertyBase FrameReference |
Read/Write Property: Draw task cycles in relation to main thread cycle time - frame cycle (percentage display).
| FBPropertyBase ActiveSampling |
Read/Write Property: Activate the sampling for time events.
Call before quering for FBProfileTimeEvent.
