You can use the Histogram menu to adjust the range of values used for the red, green, blue, or luminance channels of an image. The histogram shows the colour distribution of pixels in the front and result image for the selected channel. The horizontal axis represents the values of pixels, from black at the left to white at the right. The vertical axis represents the number of pixels with these colour values.
When working with 16-bit floating point images, the values of the histogram are represented on a logarithmic scale. When working with integer images (8, 10, or12-bit), the values of the histogram are represented on a linear scale.


The Histogram menu options are described as follows.
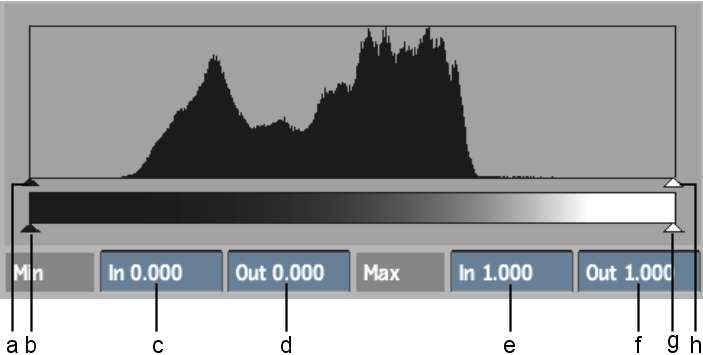
(a) Minimum Input slider (b) Minimum Output slider (c) Minimum Input field box (d) Minimum Output field (e) Maximum Input field (f) Maximum Output field (g) Maximum Output slider (h) Maximum Input slider
Input controlsUse the minimum and maximum input sliders or fields to set the input levels of your image.
Output controlsUse the minimum and maximum output sliders or fields to set the output levels of your image.

(a) Channel Selection box (b) Out Range Option box (c) Frame Selection box (d) Source View Option box (e) Destination View Option box
Channel Selection boxSelect which channel you want to work with in the histogram: Luminance, Red, Green, or Blue.
Out Range Option boxWhen using 16-bit floating point images, you can select Clamp to clamp colour and luminance values, or No Clamp to allow pixel floating point values to be less the 0 or more than 1.
Frame Selection boxChoose how you want to frame the histogram.
| Select | To Frame: |
|---|---|
| Min / Max | Based on the minimum and maximum slider values. |
| Full Range | The complete range of histogram values. |
| Plot Colour | The plot and reference colours. |
| Home | Based on a [0:1] horizontal and vertical range. |
Source buttonEnable to show a histogram of the colour values in the front, or source clip. The source colour values are obtained from the current frame. If you input both front and matte clips, the colour values in the front clip that are defined by the white part of the matte are displayed.
Source View Option boxSelect whether to display all RGB Source histograms or only the histogram you are working on (Mono).
Destination buttonEnable to show a histogram of the colour values in the result, or destination clip. The destination colour values are obtained from the current frame. If you input both front and matte clips, the colour values in the front clip that are defined by the white part of the matte are displayed.
Destination View Option boxSelect whether to display all RGB Destination histograms or only the histogram you are working on (Mono). When viewing the Source and Destination histograms at the same time in Mono mode, the Destination histograms are lighter; in RGB mode, the Destination histograms are displayed with a white outline.
Reset buttonClick to reset the settings defined by the Histogram. The Basic properties of the Colour Corrector are unaffected.
Zoom fieldSelect a vertical zoom value for the histogram display. You can also zoom horizontally by pressing Ctrl+spacebar and dragging left or right in the histogram. To pan horizontally, click spacebar and drag left or right in the histogram.


