Use the histogram in the Ranges menu to modify the shadow, midtone, or highlight ranges.
When working with 16-bit floating point images, the values of the histogram are represented on a logarithmic scale. When working with integer images (8, 10, or12-bit), the values of the histogram are represented on a linear scale.


The Ranges menu options are described as follows.

(a) Shadows curve (b) Midtones curve (c) Highlights curve
The X-axis is luma and the Y-axis is weight. The Shadow curve is labelled “S”, the Highlight curve is labelled “H”, and the Midtones curve is not labelled.
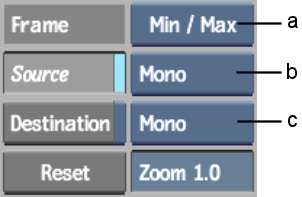
(a) Frame Selection box (b) Source View option box (c) Destination View option box
Frame Selection boxChoose how you want to frame the Ranges Histogram.
| Select | To Frame: |
|---|---|
| Min / Max | Based on the minimum and maximum slider values. |
| Full Range | The complete range of histogram values. |
| Plot Colour | The plot and reference colours. |
| Home | Based on a [0:1] horizontal and vertical range. |
Source buttonEnable to show a histogram of the colour values in the front, or source clip. The source colour values are obtained from the current frame. If you input both front and matte clips, the colour values in the front clip that are defined by the white part of the matte are displayed.
Source View Option boxSelect whether to display all RGB Source histograms or only the histogram you are working on (Mono).
Destination buttonEnable to show a histogram of the colour values in the result, or destination clip. The destination colour values are obtained from the current frame. If you input both front and matte clips, the colour values in the front clip that are defined by the white part of the matte are displayed.
Destination View Option boxSelect whether to display all RGB Source histograms or only the histogram you are working on (Mono). When viewing the Source and Destination histograms at the same time in Mono mode, the Destination histograms are lighter; in RGB mode, the Destination histograms are displayed with a white outline.
Reset buttonClick to reset the settings defined by the Ranges Histogram. The Basic properties of the Colour Corrector are unaffected.
Zoom buttonSelect a vertical zoom value for the histogram display.
To see the effect of adjusting these curves:
You should see that the resulting image is different from that in step 1. The difference is the result of the changes you made to the luma curves for the shadows, midtones, and highlights.


