The Track View Key window displays function curves and keys when in Curve Editor mode. When in Dope Sheet mode, the tracks can be displayed as keys or ranges. You select and change animation values and timing in these windows. The Key window also indicates the active time segment. Time within the active time segment is highlighted with a light gray background. The Track View Key window is sometimes referred to as the Key window.
Components of the Key window include a time slider, a time ruler, and a scale origin slider. The Track View time slider indicates the current frame and is synchronized with the viewport time slider. A time ruler at the bottom of the window can be raised to measure keys against time. A scale origin indicator (a horizontal orange line at 0) can be moved during scale value operations as a reference point for scaling.
The two main sections of the Track View workspace consist of the Key window and the Controller window.
The Controller window displays object names and controller tracks, and determines which curves and tracks are available for display and editing. Hierarchy items in the Controller window can be expanded and rearranged as necessary using the Hierarchy list right-click menu. The navigation tools can also be found in the Track View Options menu. Default behavior is to only show selected object tracks. Use Manual Navigation mode to collapse or expand tracks individually, or press Alt+right-click to display an alternate menu to collapse and expand tracks.
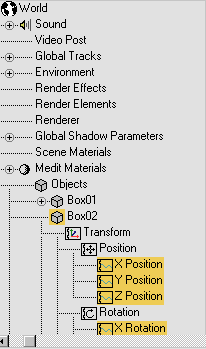
Controller window
The Key window displays the keys as either curves or tracks. The tracks can be displayed as a box graph of keys or range bars.
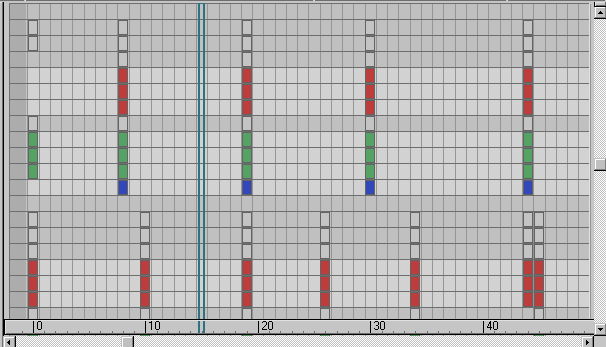
Keys displayed as box graph (Dope Sheet - Edit Keys mode)
Keys are created using a variety of methods. Keys can be created by turning on Auto Key, moving the time slider, and then transforming the object or adjusting its parameters. Keys can also be created by right-clicking the viewport time slider to access the Create Key dialog. Keys can be created directly in Track View using Insert Keys. Finally, keys can be created by turning on Set Key mode, moving to a desired frame, posing the object, then clicking Set Keys.
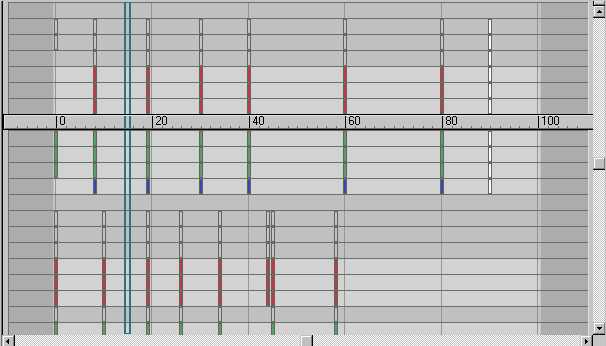
Keys are displayed as points on the function curves, or as boxes on the Dope Sheet. Keys on the Dope Sheet are color-coded for easy identification. When there are multiple tracks keyed at one frame, the boxes appear with bands of color to indicate the shared key types. Key coloration is also used to show soft selection of keys. Subframe keys (keyframes that fall between frames) are indicated as narrow rectangles within the boxes.
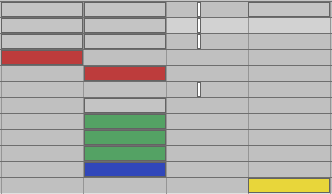
Colored keys with subframe display
Keys are also displayed on the track bar below the viewport.
Keys displayed on the function curves have tangency types. The tangency buttons found on the Key Tangents toolbar can be used to change the function curve keys. Use Custom tangency to show editable curve handles. Use Step tangency to freeze motion or create classic storyboard pose-to-pose blocking.
Function curves can also be displayed below the track bar.
Custom Tangency handles
In the Dope Sheet - Edit Ranges mode (when animation keys have been created), range bars display to indicate the range of time the animation occurs. Tools specific to working with ranges (position ranges and recouple ranges) can be found on the Ranges toolbar (off by default). Right-click the toolbar, choose Show Toolbars, and then select Range-Track View to access these tools.
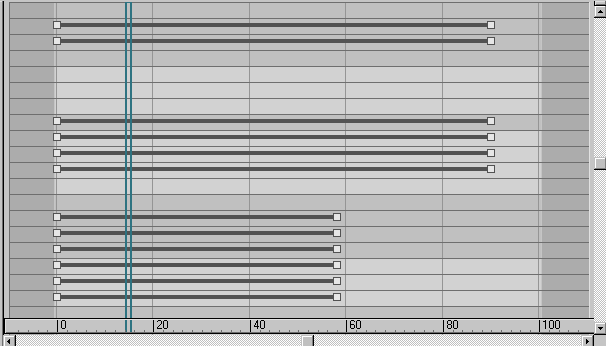
Keys displayed as range bars (Dope Sheet - Edit Ranges mode)
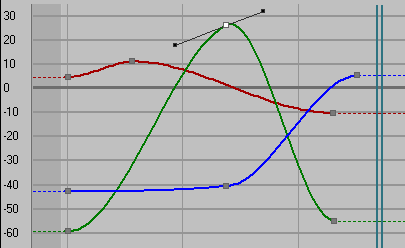
Function Curves display the values of keys, and the interpolated values between keys, as a curve. These curves express how a parameter varies over time. Only animation tracks can display function curves. You can edit the curves using tangency handles on the keys to change the shape of the curve.
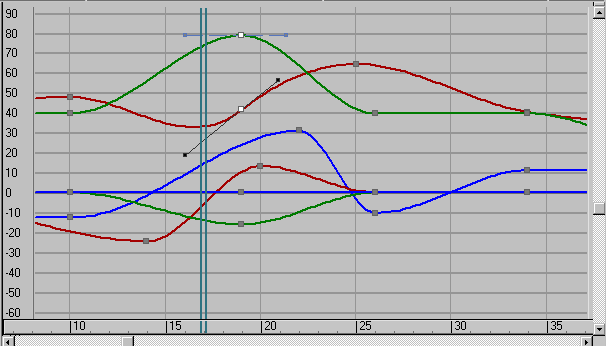
Keys displayed as function curves (Curve Editor)
Multiple curves can be viewed simultaneously by selecting tracks in the Controller window. This is especially useful when using Multiplier or Ease Curves. You can adjust the multiplier or ease curve point tangencies and watch the final result in the controller curve at the same time.
The time ruler measures time. Markings on the ruler reflect the settings in the Time Configuration dialog. Move the time ruler up to the keys for more accurate key placement.
Time ruler
The current time is indicated by the Track View time slider. This is displayed as a set of blue vertical lines synchronized with the position of the viewport time slider. You can move the Track View time slider by dragging it in the Key window. Moving either time slider updates the animation in the viewports. The blue time slider also serves as a scale origin point when scaling keys in time.
Scale keys using time slider
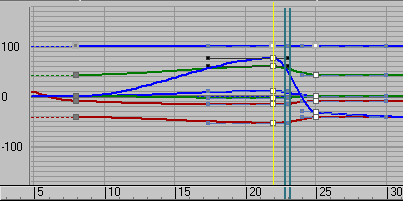
When you scale key values (that is, scaling in space rather than time), a horizontal orange line appears at the 0 value on the vertical graph axis. This orange line is a scale values origin indicator, which you can move vertically to vary the reference point for scaling values.
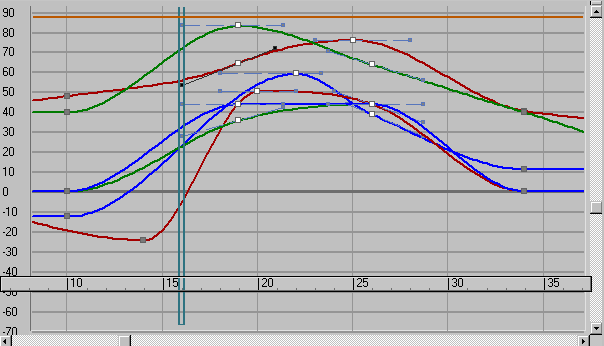
Horizontal line at the top of the illustration is the moveable scale origin line.


