Chapter 20, Color Correction
| Inverting an Image | Set Fill Color | ||
Chapter 20, Color Correction |
|||
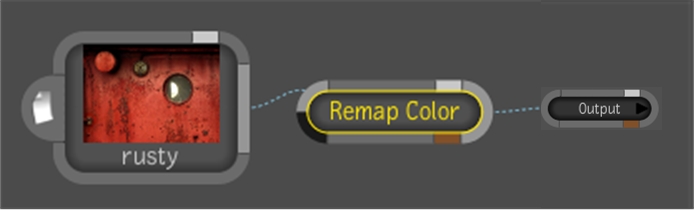
The Remap Color tool lets you view High Dynamic Range (HDR) images on a limited dynamic range display, such as a computer monitor. You can also use the Remap Color tool as a 1D LUT tool to remap an image's color output using interactive histogram and color curve tools.
For more information on 1D LUTs, see Applying LUTs.
From the Tools tab, drag the Remap Color tool from the Color Correction folder to the dependency graph in the Schematic view.
 "Show full-size image")
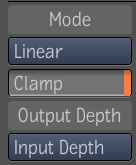
From the Remap Color UI, select a mode in which to remap the color:
Linear: Maps a given range of the input values to the output interval. You can specify which luminance value in the input maps to black and which one maps to white. In this mode, you can click the Clamp button to have the curve defined by constant output values outside the level range. Otherwise, the straight line between black and white is interpolated for the entire range.
EXRDisplay: Popular among Open EXR users, compresses a large portion of the high dynamic range into the gamut of the display without introducing clamping artifacts.
 "Show full-size image")
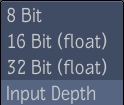
Under Output Depth, set the depth at which you want to output the image.
 "Show full-size image")
In the Remap Color UI, adjust the parameters for the mode you selected:
| Mode: | Use: | To: |
| Linear | In Min and In Max | Set the minimum and maximum input color values in the image. |
| Out Min and Out Max | Set the minimum and maximum output color values in the image. | |
| Gamma | Set the gray values. Increase to brighten and decrease to darken. | |
| EXRDisplay | Exp | Set the exposure of the image. You can lighten or darken the image to reveal detail in the high or low end. |
| Defog | Compensate for fogging due to stray light in the recording device. | |
| Knee Low and Knee Hi | Set the white level of the image, which determines which value is mapped to the maximum intensity of the display. | |
| Gamma | Set the gray values. Increase to brighten and decrease to darken. |

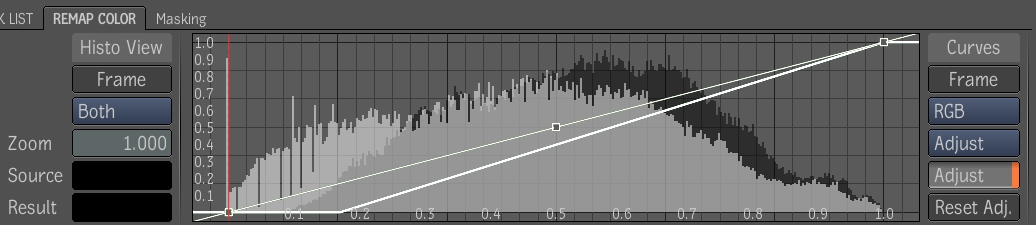
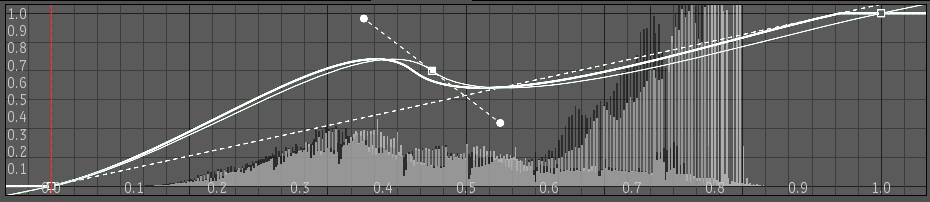
Controls on the left side of the histogram/curve viewer let you control how you want to view the histogram. The source histogram is white and the result histogram is black. By default both the source and result histogram are displayed in gray. You can view the source or result histogram, or a combination of the two at the current time.
 "Show full-size image")
| A framed histogram |
Note: The histogram is not updated during playback.
Under Histo View, click the Frame button.
Under Histo View, click the button beneath the Frame button and select Source or Result.
Under Histo View, enter a value in the Zoom box.
Do one of the following:
To zoom in, press the Up Arrow key.
To zoom out, press the Down Arrow key.
To zoom in/out, press Ctrl + Spacebar and drag.
Press the Spacebar and drag.
If you have a specific color in mind, you can set the source color by picking it from the remap color input image. Once you select a source color, the result color is automatically generated, and the orange color bar in the histogram/curve viewer moves to indicate where in the range the color exists. Then you can adjust the curve until you're satisfied. While you're doing this, a dashed color bar indicates the changes you've made to the color, relative to the source color you set.
Click the Source color pot and select a color from the image in the Player.
The result color is automatically generated.
You can view and set values for the red, green, or blue histogram channels individually or for the curve representing the entire image (RGB).
When using the Remap Color tool, there are three curves displayed in the histogram/curve viewer: the basic curve, adjusted curve, and final curve. The basic curve is the result of the mode you selected and is displayed as a dashed line. The adjusted curve is the result of any changes you made to the curve itself; this is the only curve you can directly manipulate. It is displayed as a white line. The final curve is a combination of the basic and adjusted curves, and is displayed as a heavy white line. By default, the final curve is always displayed, but you can view the basic and adjusted curves individually.
 "Show full-size image")
Under Curves, click the channel selection button (second button) and select Red, Green, or Blue.
Under Curves, click the Frame button.
Under Curves, click the curve selection button (third button) and select Adjust.
The Adjust curve is displayed.
Do any of the following:
Click the control point in the middle of the curve and adjust the tangent handles.
Add control points by pressing the Plus (+) sign and clicking the curve. Press the Esc or zero (0) key when you're done.
Delete control points by pressing the Minus (-) sign and clicking the points to delete. Press the Esc or zero (0) key when you're done.
Click the Adjust button to mute the adjusted curve.
To reset the curve, click the Reset Adj. button.
Hint: To reset the Remap Color tool, click the Reset button in the Tool UI Area.
