Show in Contents

Add to Favorites

Home: Flame

Changing the Display of Key Elements

Mastering the RGB Viewer

Selecting Key Elements in the RGB Viewer

Displaying Plotted Points
and Regions
When
you plot colour values and ranges of colour values in the key image,
you can display or hide the plotted points and regions in the RGB
viewer.
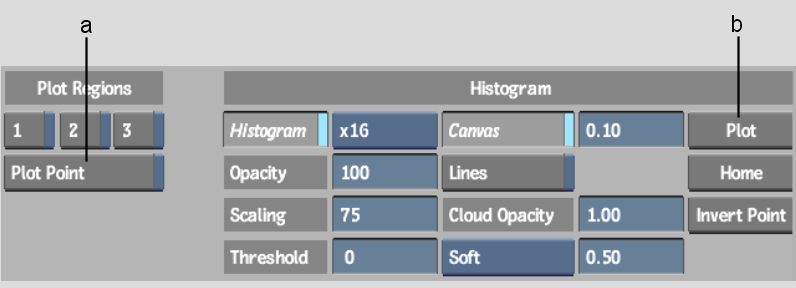
To show or hide plotted points:
- Enable or disable the Plot Point button
in the Preferences menu (or press B).
NoteWhen you plot a colour
value, the Plot Point button is automatically enabled to display
the colour value in the viewer.
To show or hide Plot Regions 1, 2, or
3:
- Enable or disable the corresponding buttons
in the Preferences menu.