The Graph Editor
The Graph
Editor displays a graphical representation of computed
camera parameters as well as providing options to edit the results.
Depending on the type of camera motion (hand-held, stabilized, motion-controlled)
and the quality of the 2D tracks, it may be useful to smooth some
or all of the computed camera parameters. Smoothing can be done
by hand, or by using a post filter.
Switch to the Graph
Editor by clicking on the Graph Editor tab
at the bottom of the Track window.
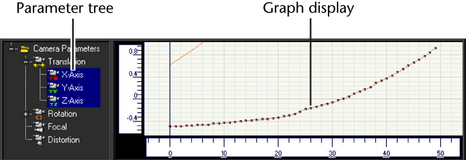
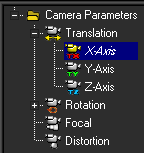
In the Parameter
Tree, you can select the parameter you want display.
The corresponding curve is then shown in the graph display.
The available parameters
are:
| Folder |
Description |
Translation
|
Contains the three components
of camera translation, named X-, Y-, and Z-axes
|
Rotation
|
Contains the three components
of camera rotation, named X-, Y-, and Z-axes
|
Focal
|
Shows how camera focal length
varies over time
|
Distortion
|
Shows how lens distortion varies
over time
|
The Graph
Display shows the curve representing the selected parameter
value over time. The X-axis always represents the time in frames,
and the Y-axis represents the parameter value.
For example, rotation
is expressed in degrees, translation is in the units defined in
the coordinate system, and the focal length is in millimeters.
Each curve is shown as
a continuous line joining the points calculated for each frame.
The color of a curve is determined by the parameter it represents.
One or more parameters can be selected and displayed at a time by
using Shift or Ctrl+right-click.
The points used to extrapolate
a curve are displayed in the Graph Display and
can be edited.
Click to close the Graph
Editor.
To restore the view,
select Window > Track Window.
To fit the graph to the
viewport, select Graph > Fit or right-click
in the Graph Editor and select Fit from
the pop-up menu.
The Graph Editor Toolbox
The Graph
Editor Toolbox is displayed when you open the Graph
Editor.
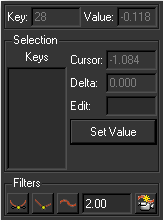
This toolbox provides
access to the MatchMover post-filtering options. As you move the
pointer over the graph, the Graph Editor Toolbox displays
information on the position of the cursor (time and position) and
the key number and its value in read-only fields.
If you select a key,
or multiple keys using a rubber band selector or pressing Shift while
selecting more keys, the keys are listed and you can set their value
by entering a number in the Value field
and clicking on Set Value.
The filter options are
displayed in the Graph Editor Toolbox. After you
have edited a camera parameter, use the recompute function  to recalculate
the effects of editing on the other parameters. See
Smoothing a curve using post filters.
to recalculate
the effects of editing on the other parameters. See
Smoothing a curve using post filters.
Toggle the Graph
Editor Toolbox display by selecting Graph
> Graph Editor > Editor Toolbox or use the pop-up
menu.
Toggling the display grid
To toggle the grid display
in the Graph Editor:
- Click in the Graph Display to
select it.
- Do one of the following:
- Select Graph > Show Grid to
display the grid.
- Right-click in the Graph Editor or the Track
Status View and select Show Grid from
the pop-up menu.
A check mark appears
beside the option indicating that the option is activated.
Locking the grid axes
To lock the X- or Y-axis
of the grid, either:
- Select Graph > X Locked or Y-Locked.
- Right-click in the Graph Editor or
the Track Status View and click X Locked or Y-Locked in
the pop-up menu.
A check mark appears
beside the option indicating that the option is activated.
Smoothing a curve using
post filters
The Graph
Editor allows you to modify curves and point values using
post filters. MatchMover has four types of post filter.
- Spline - Replaces
frame parameters with the values obtained from spline interpolation
of the neighboring values. This is useful when one frame looks “jumpy”
and neighboring frames are not. In this mode, you can change the
tangent of the curve at a given point to create a smoother curve.
- Linear - Replaces
frame parameters with the values obtained by creating a linear curve
between the first and last selected frame.
- Smooth - Applies
a smoothing filter to the computed values. This is useful to remove
the small vibrations that can appear in the computed camera path
even when the actual camera motion is smooth.
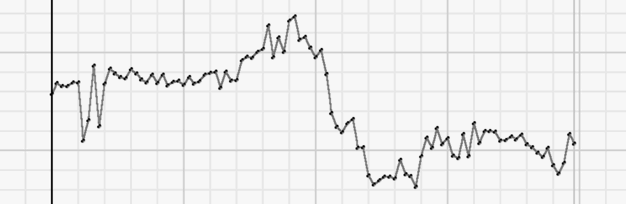
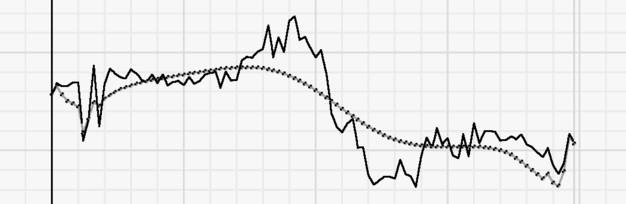
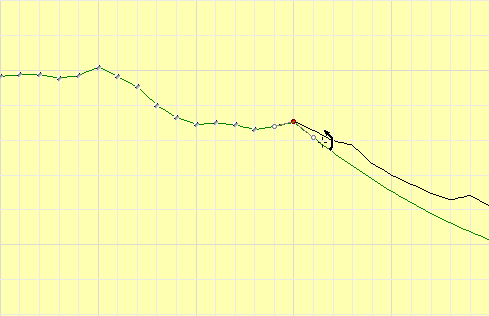
For example, if the original
camera path computed by MatchMover is too jagged, as shown below,
we will use the smoothing function to improve it.
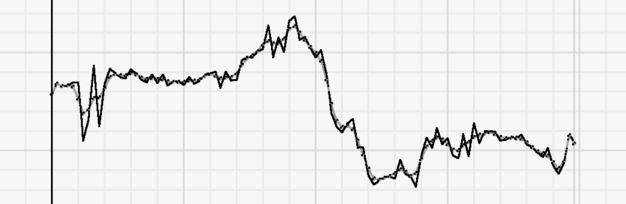
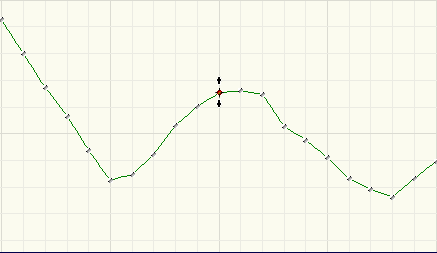
A low-strength smoothing
operation polishes the curve while keeping the general motion.
However, if the smoothing
is too strong, it will erase details and flatten the curve. Smoothing
has worsened the result and the smoothed path is further from the
solution than the originally computed one was.
Each time you modify
a curve, its name in the Project window and the Track window changes
to italic font and its corresponding icon changes to yellow.
This indicates that the
value has been modified and some recomputation may be needed.
To smooth a curve using
a post filter:
- Click the Graph Editor tab.
- Select the parameters to edit it in the
left pane of the Graph Editor. Its curve will then
be displayed in the Graph Editor.
- To select more than one parameter use Shift+click to add
new items to a current selection.
- Use Ctrl+click to
remove parameters from a selection.
TipIf you select more
than one parameter in the left pane of the Graph Editor,
several curves will be displayed in the graph area.
- Do one of the following:
- Select a frame range. A frame range is
a set of frames. In some situations, you may find that you only
need to edit a limited part of your sequence. In the graph area,
press Shift+click and drag
the mouse horizontally to include the frames you want to select.
- Select a curve point by clicking on it.
This will turn the point into a small red circle. If you are in
the Spline mode, it will also activate
the display of the curve tangents at this point.
NoteIf a time range exists,
the filter is applied only to the frames within the time range.
Frames outside the time range are unaffected. If no time range exists,
the whole of the current sequence is filtered.
- Select the relevant filter from the Graph
Editor Toolbox.
-
 to convert
a time range to spline.
to convert
a time range to spline.
-
 to convert
a time range to inear.l
to convert
a time range to inear.l
-
 to smooth
a time range. Edit the number in the corresponding text field to
define the strength of the smoothing.
to smooth
a time range. Edit the number in the corresponding text field to
define the strength of the smoothing.
- You can also set this value
in the Smoothing Strength text field
by selecting Edit > Preferences > 3D Tracking.
- Right-click in the Graph Editor and select Filter and
then a post filter from the pop-up menu.
MatchMover applies the
post filter to the selection.
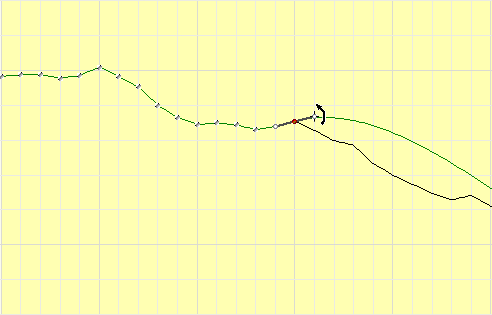
Modifying a curve manually
For more controllable
editing of a curve, you can edit points manually.
- Place the pointer over the curve point
you wish to edit. The pointer changes to
 .
.
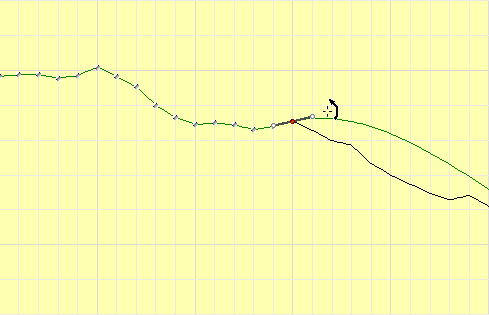
- Click the point. The point changes to
a red label with a pencil indicating that it is selected.
- Drag and drop the point to its new position.
TipYou can do exactly
the same using multiple points selection.
NoteYou can show or hide
the original curve by toggling the option Graph > Graph Editor
> Show Ghost or right-clicking in the Graph
Editor and click Show Ghost in
the pop-up menu. A check mark appears beside the option indicating
that the option is activated.
Editing tangents
You can also edit the
tangents. By default, the two vectors are aligned and synchronized.
If desired, you can desynchronize the two tangents and set them
independently.
- Run a Spline filter
on a curve.
- Select a point.
- Place the pointer over a tangent of the
point to edit.
- Move the pointer up or down to set the
tangent.
To edit tangents freely:
- Do one of the following:
- Select Graph > Free Tangents.
- Right-click in the Graph Editor and click Free
Tangents in the pop-up menu.
A check mark appears
beside the option indicating that the option is activated.
- Run a spline filter on a curve.
See
Smoothing a curve using post filters.
- Select a point.
- Place the pointer over a tangent of the
point to edit.
- Move the pointer up or down to set the
tangent.
NoteThe Free
Tangent mode causes discontinuities in the smoothness
of a curve and should be used by advanced users only.
Adding keys to and deleting
keys from the curve
To add a key to the curve,
do one of the following:
- Select Graph > Graph Editor
> Add Key.
- Right-click in the Graph Editor and select Add
Key from the pop-up menu.
To delete a key from
the curve, select it and do one of the following:
- Select Graph > Graph Editor
> Delete Key.
- Right-click in the Graph Editor and select Delete
Key from the pop-up menu.
Resetting the curve
To restore the curve
to its initial state, do one of the following:
- Select Graph > Graph Editor
> Reset Curve.
- Right-click in the Graph Editor and select Reset
Curve from the pop-up menu.