
Measures scan data to surface deviation.
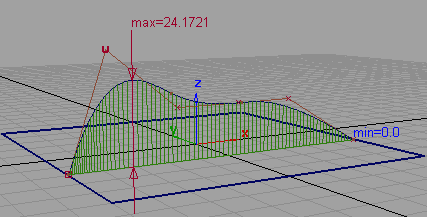
This tool lets you create and change deviation combs. It also displays the minimum, maximum and mean deviation between either a curve and a surface, or a mesh and a surface.
You only see the deviation comb display if both a curve (or mesh) and a surface are selected and Deviation is turned on in the Display section of the Control Panel.
This tool is a combination of Locators > Deviation > Curve to Surface and Locators > Deviation > Mesh to Surface, but provides additional options.
Check or uncheck the Deviation button in the Display options section of the Modeling Panel to display or hide the deviation comb quickly. Hiding the deviation comb reduces the clutter on the screen and improves the interactive performance. To display the comb once more, you do not have to set up the deviation again.
If a surface and a mesh are selected, the Show deviation tool displays the minimum and maximum deviations only.
The Deviation options appear in the Modeling Panel when you click the Show deviations icon.
icon.
Pick the curves or surface to enable the Deviation options. Only deviation combs with picked curves or surfaces are modified.
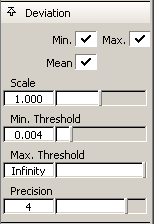
Click the check boxes to turn on or off the Minimum, Maximum, and Mean deviation locators.
Scale applied to the quills of the comb. To get a scale higher than the one given by the slider, type the value in the adjacent text field.
Only display the deviation where it is higher than the Min. Threshold value and lower than the Max. Threshold value. The Min, Max, and Mean locators are adjusted accordingly.
Use these values to eliminate “rogue points” from scan/section data, or to highlight values in a specific range.
Number of decimal places used for the Min, Max, and Mean values. The default is 4.


