Continuity is a measure of how well two curves or surfaces “flow” into each other.
Palette tool: Curves > Blend Curve Toolbox
Why you would set continuity and curve degree
Continuity is a mathematical indication of the smoothness of the flow between two curves or surfaces.
The following lists the five types of continuity possible with Alias tools, G0 to G4. Note that G3 and G4 continuity are only available with blend curves.
The endpoints of the two curves meet exactly. Note that two curves that meet at any angle can still have positional continuity.
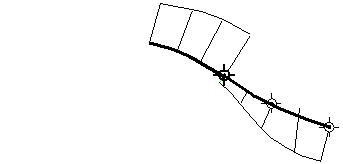
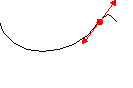
Same as positional continuity, plus the end tangents match at the common endpoint. The two curves appear to be traveling in the same direction at the join, but they may still have very different apparent “speeds” (rate of change of the direction, also called curvature).
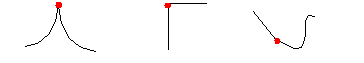
For example, in the illustration at left, the two curves have the same tangent (the double-arrow line) at the join (the dot). But the curve to the left of the join has a slow (low) curvature at the join, while the curve to the right of the join has a fast (high) curvature at the join.
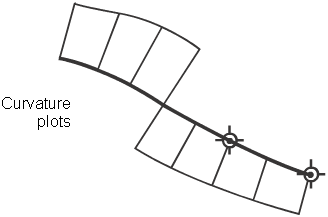
Same as tangent continuity, plus the curvature of the two curves matches at the common endpoint. The two curves appear to have the same “speed” at the join.
Curvature with constant rate of change (G3)
Same as curvature (G2) continuity, plus the rate of change in the curvature matches between the curves.
Curvature with constant rate of change of the rate of change of the curvature (G4)
Same as G3 continuity, plus the rate of change of the rate of change of the curvature matches between the curves. This is the smoothest type of join.
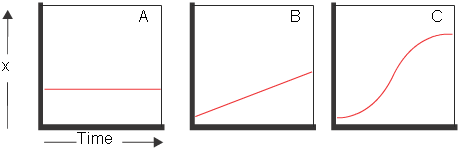
The concept of “rate of change of the rate of change” may be hard to conceptualize. Consider the following graphs: