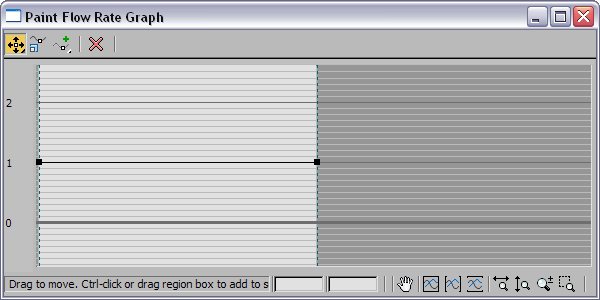
The Paint Flow Rate Graph appears when you click the Rate button on the Setup rollout of a Particle Paint helper. It allows you to animate the particle paint rate over the time of a single stroke.

The left end of the graph represent the start of the stroke, while the right end represents the end of the stroke. The values in the left column represent particles per second.
To change the curve over the length of the stroke, move control points, or add and move control points.
The controls on this dialog are similar to those on the loft deformation dialogs in 3ds Max.
 Moves control points in any direction. The exceptions are the start and end control points, which can be moved only vertically.
 Moves control points horizontally only. This button is available from the main Move button flyout.
 Moves control points vertically only. This button is available from the main Move button flyout.
 Scales selected control points with respect to the 0 value.
 Inserts a Corner point on the graph.
 Inserts a Bezier point on the graph. This type of point has handles that you can adjust for a smooth curve. This button is
available from the Corner point button flyout.
 Zoom Extents, Zoom Hoifrizontal Extents, and Zoom Vertical Extents zoom the graph in or out to fit in the window.
 Interactive zoom controls zoom horizontally or vertically, zoom the entire window, or zoom to a selected region.