There are some basic tools that let you identify and correct problems in ICE trees.
There are different types of problems you may encounter when building ICE trees:
Structural problems are caused by incompatible data types, contexts, or structures in the tree. Nodes that are in error because of structural problems are displayed in red, and other nodes in that branch that will not be evaluated because of the error are displayed in yellow. If you have red nodes, or if you cannot connect nodes that you think should be connectable, see Port and Node Messages.
If a tree is working but not doing what you think it should be doing, it may be that the values being passed to ports are not what you expect them to be. You can display port values in the scene as described in Displaying Port Values.
You can display execution times directly on nodes in the ICE tree viewer to profile the performance of your tree and see which sections are using the most processing time. See Profiling the Performance of ICE Trees.
Messages on ports and nodes help you identify structural problems caused by incompatible data types, contexts, or structure.
Hover the mouse pointer over a port to display a pop-up message showing the data types, context, and structure that the port supports, for example, "Array of 3D Vector per Point of "PointCloud.pointcloud".
To see more detailed information about a port, right-click over a port or connection and then choose Log port type details. Information is logged to the history pane of the script editor.
If a node is red (in error), hover the mouse pointer over it (not over a port) to see the first error message. To see all error messages, right-click over the node and choose Show Messages.
When you drag an output port onto an incompatible input port, a pop-up message informs you of the conflict and shows the data types, contexts, and structure that are supported by the two ports.
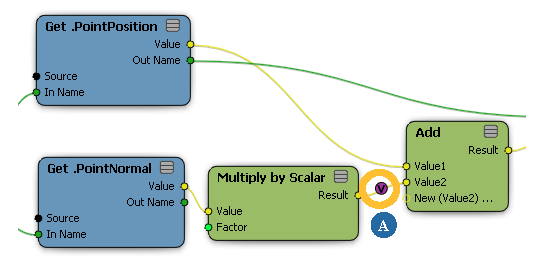
You can display port values in the 3D scene to help you visualize why a tree is giving the results that it gives. When a port's values are displayed, a "V" icon appears on the connection. The color of the icon corresponds to the color of the data in the 3D views.
Only values in branches that are connected and evaluated can be displayed.
When you export a compound, the display state of ports is saved. In particular, this lets you create compounds whose only purpose is to show values for debugging purposes. However, you may need to get and then set the same values back to ensure that the data gets pulled.
If you haven't displayed the selected port values before, the Show Values dialog box opens. Specify the desired display options and click OK. See AttributeDisplay Property Editor [Properties Reference].
To change port value display properties
Specify the desired display options and click OK. See AttributeDisplay Property Editor [Properties Reference].
Right-click over a connection or input port and choose Hide Values.
The display settings are remembered and reused the next time you display values on that port.
To hide all values in the current view
To hide all values shown for the current tree, or the current compound and its sub-compounds, do one of the following:
 Hide All Port Values.
To hide all values for the selected compounds
To hide all values shown for the selected compounds:
Hide Port Values for Selected Node(s).
To hide or unhide all port value displays in a specific view
Click the eye icon (Show menu) in a view's toolbar and toggle Display/ICE Attributes.
Click the eye icon (Show menu) and choose Visibility Options. On the Attributes tab, toggle Display/ICE Attributes. You can set this option separately for selected and unselected objects.
Note that this affects both AttributeDisplay properties on objects as well as port value displays in ICE trees.
To hide or unhide all port value displays in all views
Choose Display Visibility Options (All Cameras). On the Attributes tab, toggle Display/ICE Attributes. You can set this option separately for selected and unselected objects.
Note that this affects both AttributeDisplay properties on objects as well as port value displays in ICE trees.
You can log the values that are passed along a connection to a port. This lets you use the history pane of the script editor to analyze the behavior of a tree.
Connect a Log Values nodes from the Debug category of the Tools tab of the preset manager between two ports in the tree. Both the In and Out ports of the Log Value node must be connected.
If desired, set or connect the Log Value node's other ports and parameters. See Log Values [ICE Reference].
Force the tree to recalculate somehow, for example, by advancing one frame on the timeline.
Profiling the Performance of ICE Trees
You can profile the performance of ICE trees by displaying execution times directly on nodes in the ICE tree viewer. This shows you which nodes take the most processing time, and lets you see where you can try to optimize the tree.

To profile the performance of ICE trees
This setting is per tree, so you should start the performance timers on all trees that you want to profile.
Display performance highlights: Time (Top Thread) or Time (All Threads).
You can stop the timers or leave them running as desired.
See Interpreting Timer Data for information about what the numbers mean.
If required, make some changes to the ICE tree and profile it again.
If you don't want to accumulate timing data, make sure to reset the timers first.
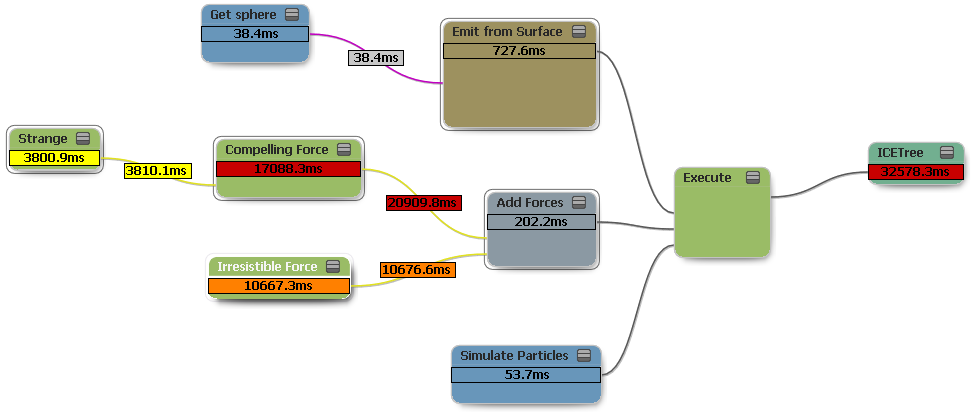
When you display performance highlights, the numbers on each node indicate how long that node took to execute, and the numbers on the connections indicate the how long that branch took to execute (that is, the time taken by all nodes upstream). These values are meant as rough guides and won't add up exactly because of various overheads.
The nodes and connections that took the longest to execute are highlighted in yellow, orange, or red depending on what percentage of the total time of the tree or compound that they took. Note that Execute nodes and connections do not always show execution times because of how they work internally.
For Time (All Threads), the numbers show the total time taken by all threads. The number on the root node shows the time taken for the evaluation of the entire tree.
For Time (Top Thread), the numbers show the time taken by the longest thread for each node and connection. In this mode, the numbers do not add up because different threads may take the longest amount of time in different nodes on the same branch. The number on the root node shows the total time taken for the evaluation of the entire tree plus any inputs that were called and evaluated — for example, if the tree gets the point positions of an object, the time taken to evaluate any deformations is included.
When analyzing these numbers, here are some things to keep in mind:
If the value shown by Time (Top Thread) is high but still close to the average, that is, close to the value shown by Time (All Threads) divided by the number of threads on your computer, then all you can conclude is that a node did a lot of computing. There may be very little you can do to optimize it further, except to avoid computationally expensive nodes — for example, use Squared Length instead of Length when comparing vectors, or do some checking to avoid calculations unless necessary.
If the value shown by Time (Top Thread) is much larger than the average, then it represents a bottleneck or a critical path in the tree. Depending on your tree, you may be able to rearrange the nodes and branches to minimize the impact of bottlenecks.
If the times shown by Time (Top Thread) and Time (All Threads) are identical, then the node was not multithreaded at all. This may be because a custom node does not support multithreading, but it is also normal when dealing with a small amount of data. Multithreading imposes an overhead, and ICE does not multithread if it's not worth doing.
It's normal to have small numbers on nodes that were not executed at all (for example, because of an If node). This time represents initialization and pre-evaluation.
When there are multiple connections from an output port, it's normal that most of the evaluation time is shown on the first connection that gets pulled. The other connections typically show the time taken to retrieve the cached values. However, if two or more output connections from the same port show high values, then you should consider storing and retrieving the data as a custom attribute.
If there are multiple connections between a pair of nodes, then the same time is shown on all connections. This is the total time taken by all the connections between the nodes, not the time taken by each one individually. Make sure not to count this value twice when comparing branch times.
It can sometimes appear as though a node turns back the clock and the time taken by its input connections is greater than the time taken by the output connection that pulls the node first. This is an illusion caused by multiple output connections — some of the time taken by the input connections is counted against the other output connections. The total time taken by all the inputs plus the node itself is roughly equal to the total time taken by all the outputs.
Sometimes the time shown on a compound and the time shown on its output connection are different. This is likely due to various overheads.