To help you with the synchronization of audio with animation, you can view an audio clip's waveform in the background of the function curve editor's graph, as well as in the timeline.
Displaying Waveforms in the Timeline
If the selected object has one or more audio clips loaded in its animation mixer, you can display waveforms for them in the timeline. This helps you synchronize the animation with the sound because you can easily see where each audio clip occurs in time.
Displaying Waveforms in the Fcurve Editor
The waveform is drawn at the proper time and scale, corresponding to the audio clip to which it is associated. The waveform also reacts to any value changes you make to the audio clip; for example, if you move or scale the audio clip, the waveform is updated to display this information.
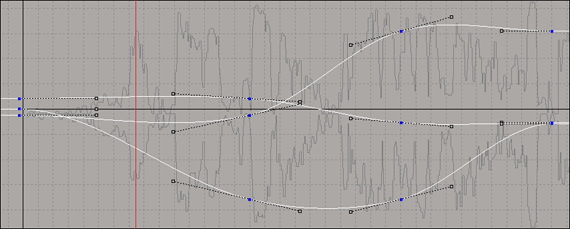
Audio waveform displayed in a ghosted gray in the background of the fcurve graph.
To display the waveform in the fcurve editor
Drag and drop an audio clip from the mixer or an explorer (in the model's Mixer  Tracks Audio Mixer Audio_Trackn Clip List folder) into the fcurve editor's graph.
Drag and drop an audio source from an explorer or an audio file from a browser into the fcurve editor's graph.
If the audio source didn't already have a clip, one is automatically created for it under the current model.
If the audio source has multiple clips with different models, a menu pops up in which you can choose the clip's "owner."
The waveform stays fixed on the vertical axis, so it won't move or scale as you pan or zoom vertically.
To toggle the display of the waveform
Open the Fcurve Editor Preferences property editor by choosing File Preferences in the fcurve editor's command bar.
Click the Audio tab and toggle the Audio Waveform Display option.
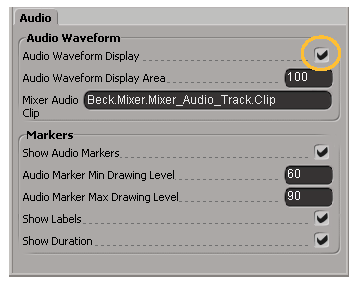
As well, the Mixer Audio Clip parameter shows the full path of the current audio file being displayed (ex. Mixer.Mixer_Audio_Track.Clip). You can enter a new path or delete this field to clear the audio clip.
To change the size of the audio waveform
By default, the waveform is displayed using 100% of the fcurve graph, but you can change the amount of the display area it takes up.
On the Audio page in the Fcurve Editor Preferences property editor, set the percentage value for the Audio Waveform Display Area.
The waveform is always drawn starting from the upper-left corner of the graph. So, for example, if you change the amount of display area to take up 50%, the waveform is drawn at half the original height, but also shifts up in the graph.
If the audio clip whose waveform you're displaying in the fcurve editor has markers, you can also display them in the fcurve editor. The markers in the fcurve editor are for display purposes only, so you cannot select or move them.
For information about creating markers and setting their values, see Marking Frames on Clips.
To display markers and labels associated with the audio clip
On the Audio page in the Fcurve Editor Preferences property editor, toggle the Show Audio Markers, Show Labels, and Show Duration options:
To set the marker display level
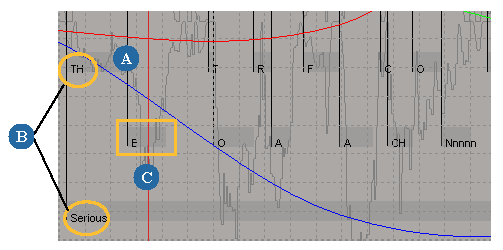
The marker display level is also taken into account. The smallest level is drawn from the top of the view about half way down and the largest level is drawn close to the bottom.
Set the Audio Marker Min Drawing Level to set how high up the smallest level of markers is drawn. The lower the value, the higher up in the graph they are displayed.
Set the Audio Marker Max Drawing Level to set how low the largest level of markers is drawn. The higher the value, the lower down in the graph they are displayed.


