The Smart Plot area includes the following three options that let you plot keyframe animation without adding unnecessary keyframes:
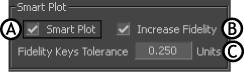
Smart Plot area
The Smart Plot option lets you plot keyframe animation without adding extra keyframes. For example, this option is useful when you want to merge the keyframes you set on many layers. Using Smart Plot, you can merge the keyframe layers without adding more keyframes, letting you continue to edit your original keyframe animation easily.
For example, plotting a function curve that has three keyframes without using Smart Plot creates many keyframes, which are too numerous to edit easily. However, when plotted using Smart Plot, the resulting animation still has only three keyframes.

Keyframe animation A. Original keyframes B. Keyframes plotted without Smart Plot C. Keyframes plotted with Smart Plot
The Increase Fidelity option lets you add the number of keyframes necessary to keep your original animation. Keyframes are added to the three curves (translation, rotation, and scaling) of each vector, making the plotted animation closer to the original animation.
There are some situations in which plotting using Smart Plot alone does not reproduce the original animation. In these cases, you can activate the Increase Fidelity option to add keyframes and correct the function curves.
For example, Cube_source rotates to the left, then upwards. Its animation consists of three keyframes at frames 0, 30, and 60.
Cube1 is connected to Cube_source by a Parent-Child constraint, and moves beside Cube_source in two arc-like movements. No keyframes are set on Cube1, only on Cube_source.
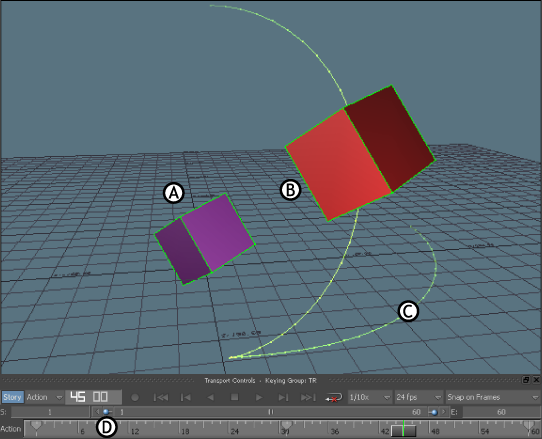
Animation using a Parent-Child constraint A. Cube_source B. Cube1 C. Cube1’s curved animation trajectoryD. Keyframes set on Cube_source at frames 0, 30, and 60
If you plot this animation using Smart Plot without Increase Fidelity, the keyframes at frame 0, 30, and 60 are plotted to both cubes, but the animation’s trajectory changes (see B in the following figure) because Cube1 needs more keyframes to retain its original animation.
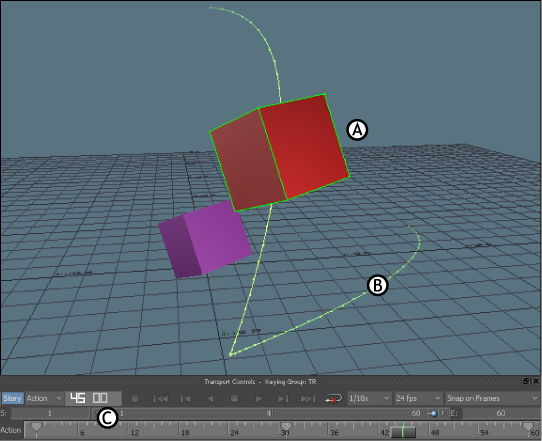
Animation plotted without Increase Fidelity A. Cube1 B. Cube1 trajectory altered C. Three few keyframes plotted to Cube1
If the Increase Fidelity option is active when the animation is plotted, keyframes with translation values are set to correct the function curve and retain the original animation (see B in the following figure).

Animation plotted using Increase Fidelity A. Cube1 B. Cube1 trajectory similar to the original animation C. Keyframes plotted to Cube1 recreate original animation
To determine the number of keyframes that are set, use the Fidelity Keys Tolerance field.
The Fidelity Keys Tolerance field lets you determine the plotted animation’s accuracy compared to its original animation. Depending on the field’s value, extra keyframes are set to duplicate the original animation.
The value in the Fidelity Keys Tolerance field is a unit of measurement which represents how far, or to what degree, the plotted animation diverges from the original animation. The lower the field’s value is, the more keyframes are set when plotting, correcting differences between the original animation and the plotted animation.
For example, in the following figure, the Fidelity Keys Tolerance field is set to 0.25, which is the default setting. Plotting sets many keyframes to Cube1, recreating the original animation path. However, you may not want so many keyframes.
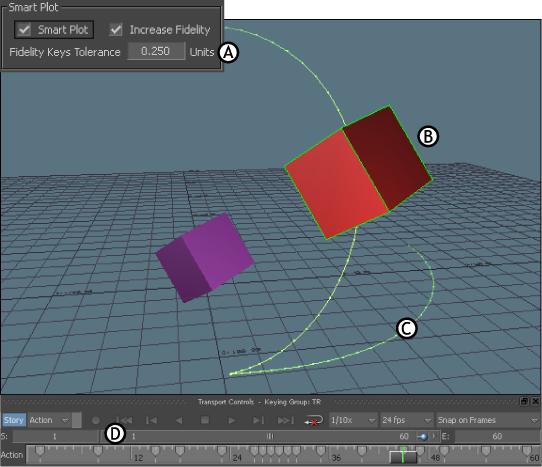
Plotting A. Fidelity Keys Tolerance field B. Cube1 C. Cube1 trajectory similar to the original animation D. Keyframes plotted to Cube1 recreate original animation
When the Fidelity Keys Tolerance field is set to a higher value, plotting sets fewer keyframes, but the animation path can change depending the number of keyframes.
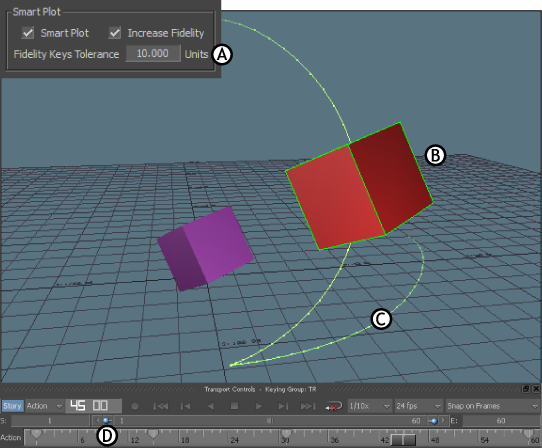
Plotting A. Fidelity Keys Tolerance field B. Cube1 C. Cube1 trajectory different than the original animation D. Five keyframes plotted to Cube1
You can also use the FCurves window to compare the animation. For example, compare the X-axis Rotation function curves of the animation shown in the following figure A and B.
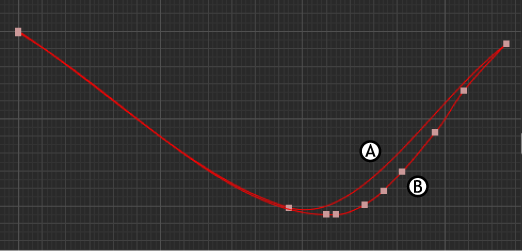
FCurves window A. Rotation function curve of Cube1 with Fidelity Keys Tolerance field set to default value (0.25)B. Rotation function curve of Cube1 with Fidelity Keys Tolerance field set to default value (10.0)
 Except where otherwise noted, this work is licensed under a Creative Commons Attribution-NonCommercial-ShareAlike 3.0 Unported License


