The Cancel button closes the dialog box without applying any options or plotting.
The Plot button plots the selected models and properties with the options that are set and closes the window.
Depending on your plot settings, the message “Too Many Keyframes to Edit” may appear on the Action timeline. This happens because plotting can create keyframes than can be visually represented and edited on the Action timeline. You can still edit the plotted data in the FCurves window, and you can zoom on sections of the timeline to see all keyframes.
When you plot, the data from the take (source) is applied to the selected objects (destination). When the current take is finished plotting, the data from the take is recorded to the model.
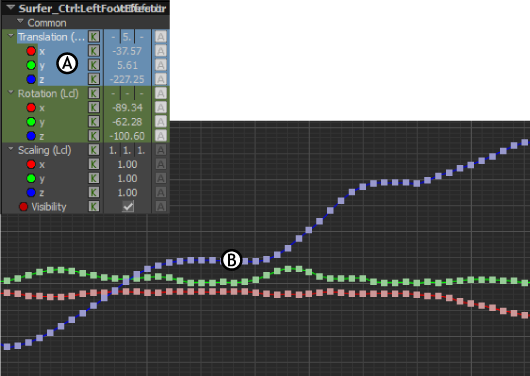
You can view your plotted data by selecting your model and viewing the function curves in the FCurves window. When you select a property on which the take was plotted, the function curve displays the plotted data. Also, these function curves display in pastel colors.
For example, the following figure shows the result of plotting a take to a cube’s translation function curves in the FCurves window.

Take plotted to a marker’s translation function curves A. Translation function curves selected B. Animation function curves displayed
 Except where otherwise noted, this work is licensed under a Creative Commons Attribution-NonCommercial-ShareAlike 3.0 Unported License