


To deform animation curves with the lattice manipulator
The lattice appears in the curve view. The lattice forms a bounding box around the selected keys.
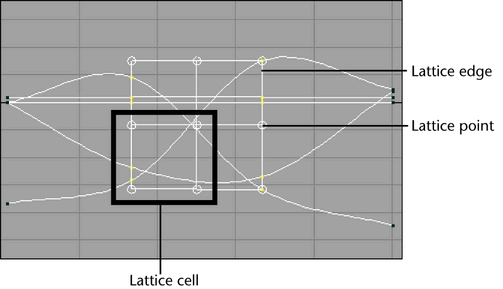
 -click lattice points to include them in or remove them from your selection. You can not select more than one lattice edge
or cell at a time.
-click lattice points to include them in or remove them from your selection. You can not select more than one lattice edge
or cell at a time.
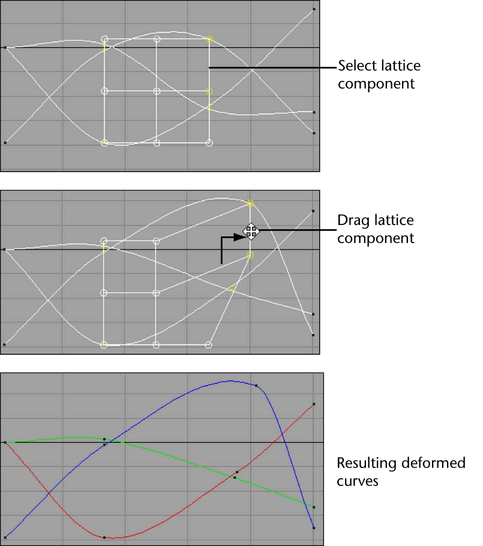
 -drag to deform the target curve region.
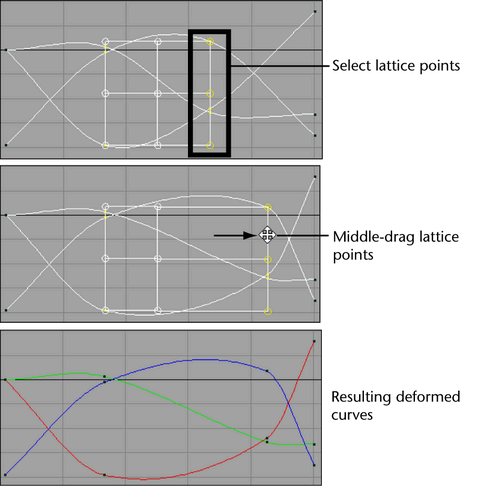 -drag to scale the selected lattice region. Scaling the lattice deforms the affected curves.
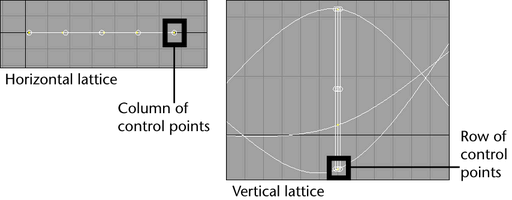
When using the Lattice Deform Keys Tool to deform keys that lie on a single axis, selecting one lattice point in a row (vertical) or column (horizontal) selects all the points in that row or column.
For example, if you select a lattice control point on a horizontal lattice, all of the lattice points in the selected point’s column are also activated. Depending on your current dolly-view scale in the Graph Editor, not all the selected lattice points may be visible. The visibility of the selected lattice points does not affect the functioning of this tool.