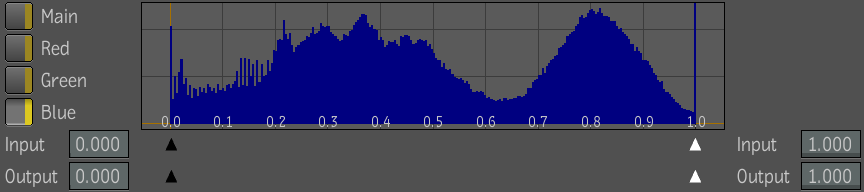
Controls on the left side of the histogram/curve viewer let you control how you want to view the histogram. The source histogram is white and the result histogram is black. By default both the source and result histogram are displayed in gray. You can view the source or result histogram, or a combination of the two at the current time.
To view the source or result histogram:
To zoom the histogram/curve viewer:
To pan the histogram/curve viewer:
If you have a specific color in mind, you can set the source color by picking it from the remap color input image. Once you select a source color, the result color is automatically generated, and the orange color bar in the histogram/curve viewer moves to indicate where in the range the color exists. Then you can adjust the curve until you're satisfied. While you're doing this, a dashed color bar indicates the changes you've made to the color, relative to the source color you set.
 Except where otherwise noted, this work is licensed under a Creative Commons Attribution-NonCommercial-ShareAlike 3.0 Unported License


