You can view and set values for the red, green, or blue histogram channels individually or for the curve representing the entire image (RGB).
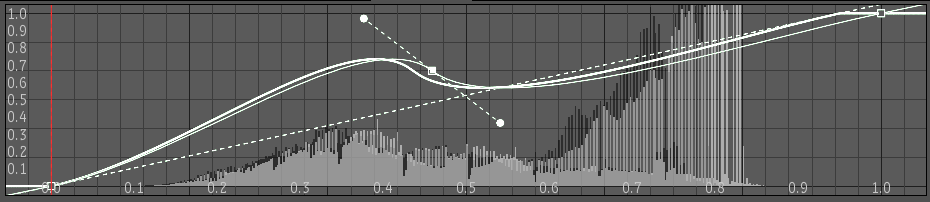
When using the Remap Color tool, there are three curves displayed in the histogram/curve viewer: the basic curve, adjusted curve, and final curve. The basic curve is the result of the mode you selected and is displayed as a dashed line. The adjusted curve is the result of any changes you made to the curve itself; this is the only curve you can directly manipulate. It is displayed as a white line. The final curve is a combination of the basic and adjusted curves, and is displayed as a heavy white line. By default, the final curve is always displayed, but you can view the basic and adjusted curves individually.
To view individual R, G, or B curves:
 Except where otherwise noted, this work is licensed under a Creative Commons Attribution-NonCommercial-ShareAlike 3.0 Unported License


