Learning Resources > Tutorials > Getting Started with Maya > Fluid Effects > Lesson 2: Creating a non-dynamic 3D
fluid effect >
Texturing the contents
of a fluid container
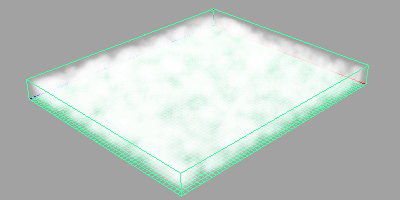
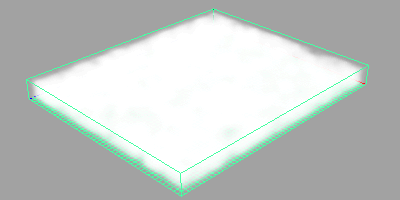
So far the container is filled with solid white Density. To create the cloud effect, you texture the Density so that some areas are transparent and some areas are opaque.
To texture the density of a fluid
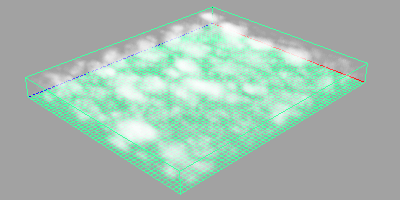
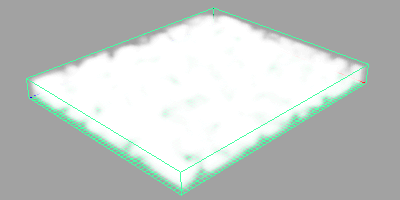
Notice that the Density now has a slightly blotchy look to it, with areas that are more opaque and areas that are more transparent. This texture provides the standard 3D noise used in the 3D Solid Fractal texture included with Maya.
The Billow texture is computationally intensive and therefore slower than the other texture types.
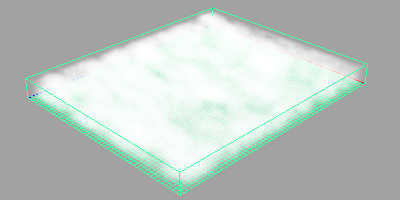
Decreasing the Amplitude makes the areas with low Density more transparent and the areas with high Density more opaque.
Increasing Depth Max adds detail. Increasing it will also increase render time.
In the Attribute Editor, go to the Shading section. Look at the Opacity graph in the Opacity subsection. This graph represents the relationship between Opacity values and Density values (the Opacity Input).
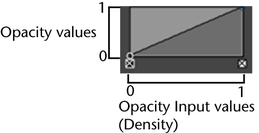
Opacity values range from 0 on the bottom (totally transparent, no opacity) to 1 on the top (totally opaque).
Density values range from 0 on the left side (no Density) to 1 on the right side (high Density).
So for the linear graph shown above, where Density values are 0, Opacity values are 0, making the Density totally transparent, where Density values are 0.5, Opacity values are 0.5, making the Density partially opaque, and where Density values are 1, Opacity values are 1, making the Density totally opaque.
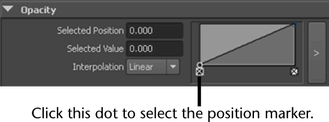
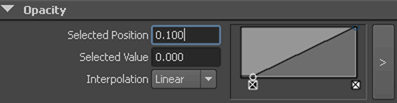
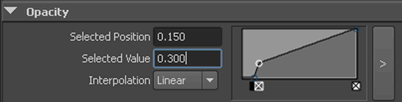
The position marker moves to the right. Now, for Density values between 0 and 0.10, the Opacity values will be 0. This means that Density that was previously partially transparent will be completely transparent.
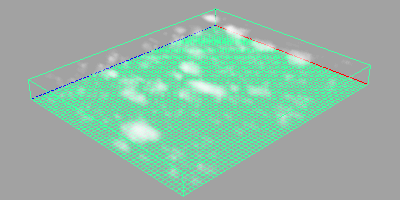
The more transparent areas of cloud disappeared, but now the solid areas of cloud are less opaque.
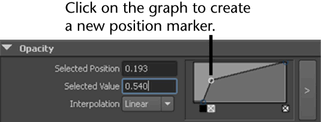
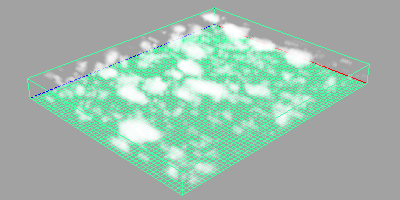
Density values that are greater than 0.15 are now more opaque, and the transition between areas of total transparency (Opacity 0), and areas where the Density becomes more visible (Density 0.15) is less gradual.