


The tools on the Diagnostics rollout can help you understand why the mental ray renderer is behaving in a certain way. The Sampling Rate tool, in particular, can help explain the renderer's performance.
Each of these tools generates a rendering that is not a photorealistic view, but a schematic representation of the functionality you have chosen to analyze.
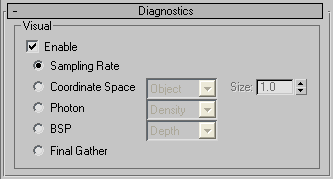
When chosen, renders an image that shows where samples were collected during rendering; see Sampling (mental ray Renderer). This can help you adjust the contrast and other sampling parameters.
Renders an image that shows the coordinate space of objects, the world, or camera.
Renders the effect of a photon map in the screen. This requires that a photon map be present (to render caustics or global illumination). If no photon map is present, the Photon rendering looks just like the nondiagnostic rendering of the scene: the mental ray renderer first renders the shaded scene, then replaces it with the pseudocolor image.
Renders a visualization of the parameters used by the tree in the BSP ray-trace acceleration method. If a message from the renderer reports excessively large depth or size values, or if rendering seems unusually slow, this can help you locate the problem.
Renders the scene with pre-processing final-gather points displayed as green dots, and tile-rendering (final render) final-gather points displayed as red dots.
For animation purposes, the presence of red dots is undesirable. To resolve this, use the Interpolate Over Num. FG Points setting instead of the Radius Interpolation Method, or, if you prefer the latter, keep the Min. Radius setting as close as possible to the Radius setting; that is, the maximum radius.

