Now that you have created a Light Meter and adjusted the distribution of its sampling points in your model, you are ready to use the points to calculate the lighting intensity.
You will process the Light Meter for midday, then take another reading for a period later that day to see how the change in sun position affects light distribution in the model interior.
 open arena_02.max.
Sky models are a set of luminance distributions that model the sky under a range of conditions, from overcast to clear sky. 3ds Max Design comes with three available sky models: Haze-Driven, Perez All-Weather, and CIE.
Perez All Weather and CIE are the models best suited to lighting analysis.
 select the Daylight system sun object, then go to the
  Modify panel. In the “mr Sky Parameters rollout”
  Sky Model group, open the drop-down list and choose CIE.
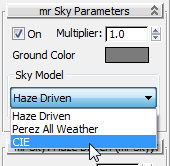
CIE stands for Commission Internationale de l’Éclairage, which is a body responsible for the international coordination of lighting-related technical standards. This sky model uses the CIE-based standard of luminance distribution.
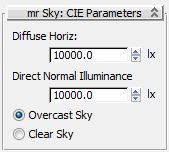
By default, Overcast Sky is chosen. This ensures that the lighting analysis can evaluate light when its intensity is at its lowest.
The Diffuse Horiz (Horizon) control is set to 10,000 lux. This value establishes the distribution of daylight along the horizon, with no direct sunlight taken into account.
This value corresponds to the light intensity for the geographic location of your model. Light intensity increases, the closer you are to the equator, approximately by the values provided in the next illustration.
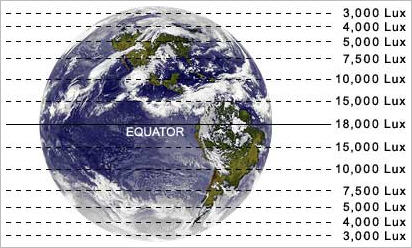
Global daylight intensity levels
The Direct Normal Illuminance control beneath Diffuse Horiz lets you set sun intensity, as if the light meter was pointed directly at the sun.
 select the Light Meter Helper object.
If you prefer, press H and from the Select From Scene dialog, select LightMeter Helper001.
Modify panel Display rollout and click Calculate All Light Meters.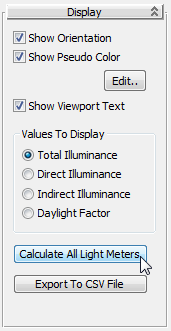
A progress bar appears in the status-bar area of the 3ds Max Design window. After a few moments, the viewports update to display the readings calculated by each sample point, based on the lighting data you defined for the CIE sky model.
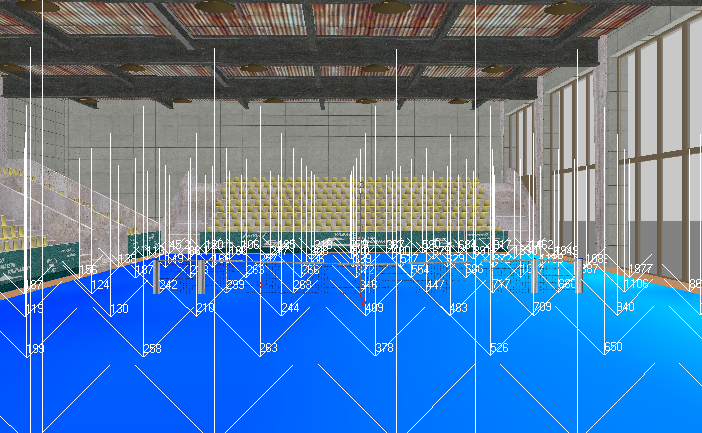
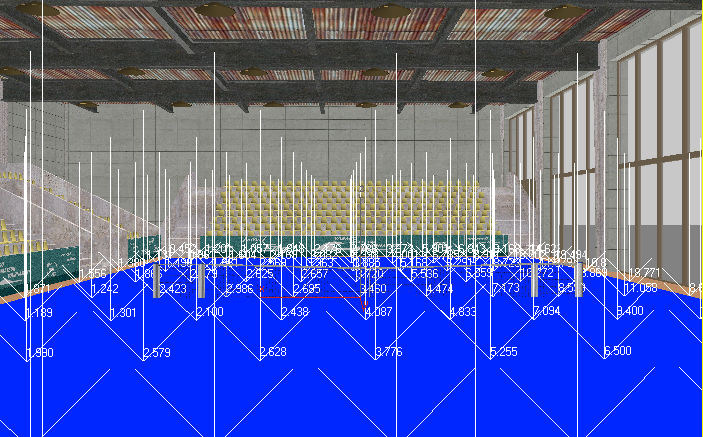
Camera viewport shows light meter readings based on luminance from the CIE sky model
Sample point data is more clearly visible, with combined direct and indirect luminance values ranging from nearly 2,000 for points next to the window to less than 120 for points farther in the model interior.
It is generally recognized that for everyday use, interior spaces should not fall below 250 lux. This means the tennis court interior, under overcast conditions, would require artificial, man-made lighting systems to provide added illumination.
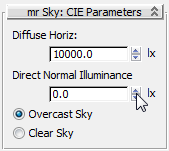
Modify panel and in the Display rollout Values To Display group, choose Direct Illuminance.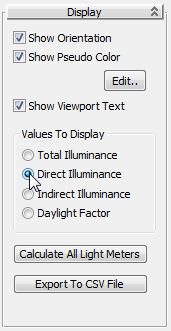
The sample points all return a value of 0 because, being an overcast day, there is no direct sunlight to record.
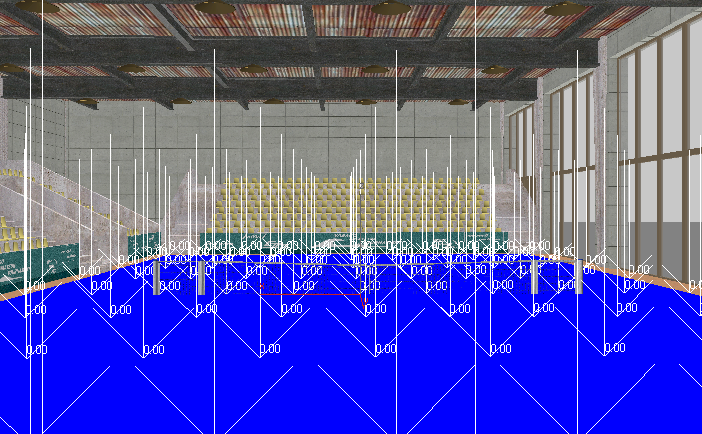
Light meter readings detect no direct luminance
The values are identical to those of step 2, because Total Illuminance measured no direct sunlight.
Light meter readings showing Daylight Factor
The values show the percent of outdoor sun striking the area occupied by each sample point. The values from 5.2 to 6.5 returned by the sample points at the lower right of the viewport equal roughly five to six and a half percent of the 10,000 lux value of estimated outdoor horizontal diffuse light intensity you set earlier. If you choose the Total Illuminance option again, that percentage value is expressed in lux units.
The next graphic illustrates how light can be cast differently in a scene, depending on which CIE sky model you choose. On the left, the sky dome shows a light gradient generated by the Overcast Sky model; on the the right, the sky dome shows a gradient under the Clear Sky model.
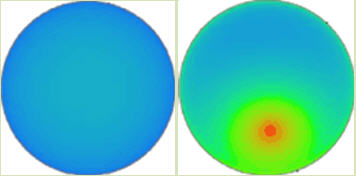
Left: Light gradient of an Overcast Sky model
Right: Light gradient of a Clear Sky model
A problem exists, however, when you use either the Overcast Sky or Clear Sky option. For the Light Meter to return accurate values that correspond to the geographic location of your model, you need to make a sometimes arbitrary decision to set the scene for clear or overcast conditions. You also need to specify a corresponding lux value in the Direct Normal Illuminance spinner box based on the geographic location of the model. You might not always know this value.
A better alternative is to use a weather file, one that takes into account weather variations on an hourly or monthly basis based on real-life meteorological observations.
Set daylight parameters from a weather data file:
select the Daylight system sun object, go to the Modify panel, and in the “mr Sky Parameters” rollout Sky Model group, open the drop-down list and choose Perez All Weather.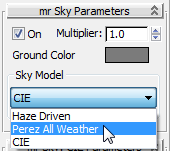
Unlike the CIE Sky Model, Perez All Weather does not include the Overcast Sky and Clear Sky options. This information is provided by the weather data file you will use to define the sky illumination gradient.
The U.S. Department of Energy Web site opens to the EnergyPlus Energy Simulation Software Weather Data Web page.
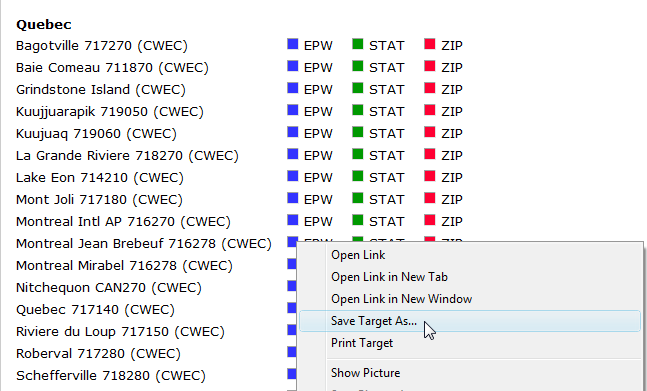
The EPW file contains all the data you need to perform the lighting analysis.
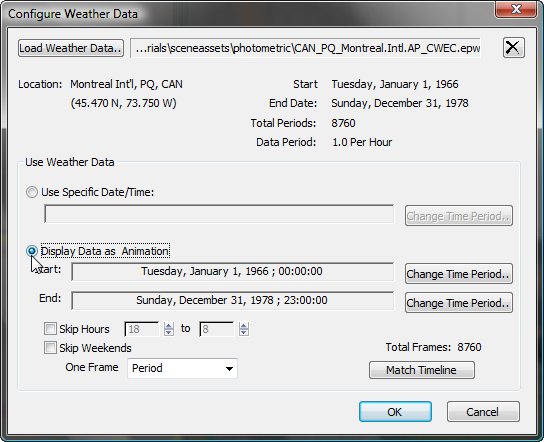
Modify panel Daylight Parameters rollout Position group, choose Weather Data File, then click Setup.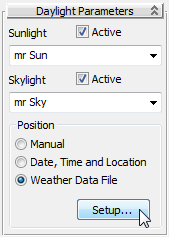
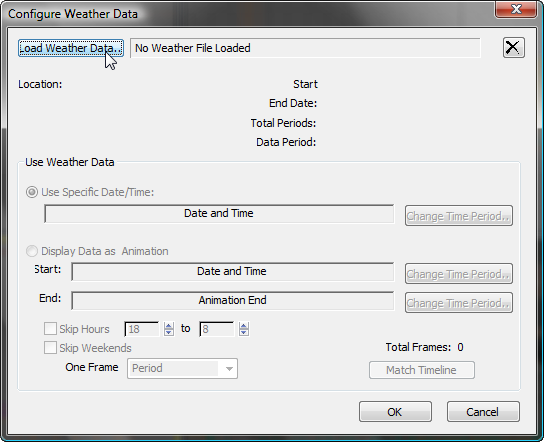 Use Weather Data group, click Change Time Period.
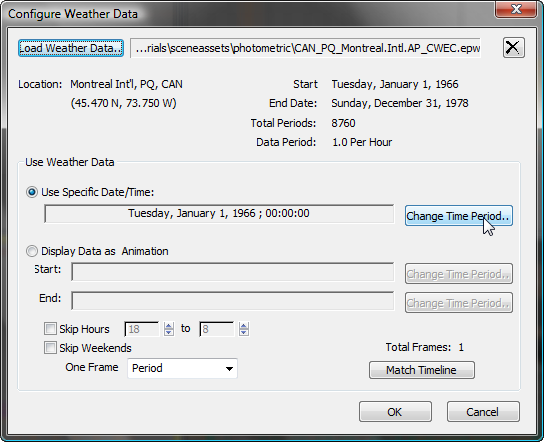
By default, the weather data is set to January 1st, 1966, at noon, but you will choose a summer date.
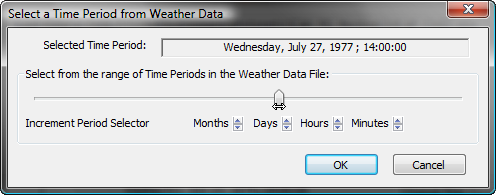
Use the Increment Period Selector controls to narrow down the selection if you need to. Click OK.
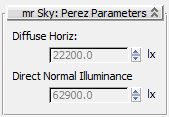
Now the “mr Sky: Perez Parameters” rollout Diffuse Horizontal and Direct Normal Illuminance fields display the diffuse lighting and direct lighting applied to the Perez model by the weather data file.
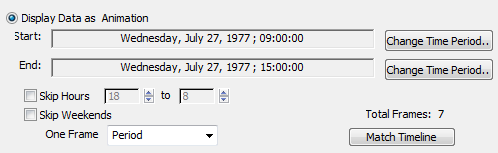
Next, you will extract a range of weather data to see how the illuminance values change over a six-hour period of time, ranging from mid-morning to mid-afternoon.
Choose a range of weather data:
Modify panel and in the Daylight Parameters rollout Position group, click Setup.
The Use Weather Data group indicates a total of seven frames created as a result of the selection range.
 Modify panel, scroll to the “mr Sky: Perez Parameters” rollout and see how the illumination values now reflect the 9 AM sampling
time.
Modify panel, scroll to the “mr Sky: Perez Parameters” rollout and see how the illumination values now reflect the 9 AM sampling
time.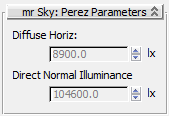
The Diffuse Horiz value is not that high, indicating low ambient luminance, but the high value in the Direct Normal Illuminance box suggests exposure to a great deal of direct sunlight for that particular morning in 1977.
The light is more evenly distributed between direct and indirect illumination.
As you can see, by specifying a range of sampling times, you can get an idea of how daylight illumination can affect a model at different times of the day.
select the Light Meter object.
Modify panel Display rollout, make sure Total Illuminance is chosen, and then click Calculate All Light Meters.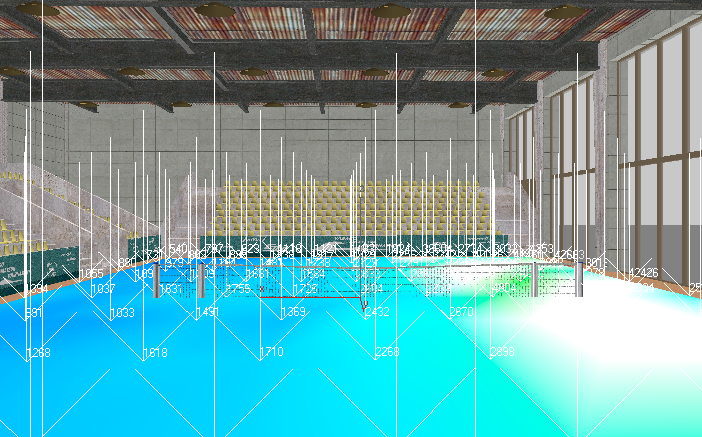
Light meter readings based on direct suinlight conditions
The level of illumination is much higher than that detected using the CIE Sky Model, even in the areas farthest from the windows. This is because the scene illumination is based not on an overcast day, but on a day of direct sunlight.
The Light Meter object uses color coding to help you visualize the lighting intensity in a scene. Lower intensities are displayed in cool colors such as blue and green, while higher intensities are shown in orange and red.
The tennis court interior displays cool blue to the left, with even the lowest values in the acceptable illumination range, greater than 250 lux. To the right, by the windows, the color ramps up to pure white. White areas indicate that the illumination values are outside the color-coding range. You now need to adjust the color coding to obtain a more even gradient, so you can evaluate better the areas of high illumination.
Adjust lighting analysis color feedback:
Lighting Analysis Assistant, and go to the General panel.
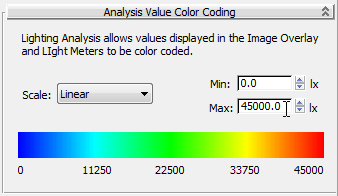
The Analysis Value Color Coding rollout displays a color ramp. The ramp intensity range is currently set between 0.0 and 10000.0 units. The units are in lux (lx), the international unit of measure. If you prefer, you can switch to the American unit of measure, foot-candles (fc) on the Units Setup dialog.
Given that the scene illumination is over 42,000 lux in places, the color range is currently too narrow. You need to widen the color ramp range.
In the viewport, the color range now shows light intensity much more effectively.
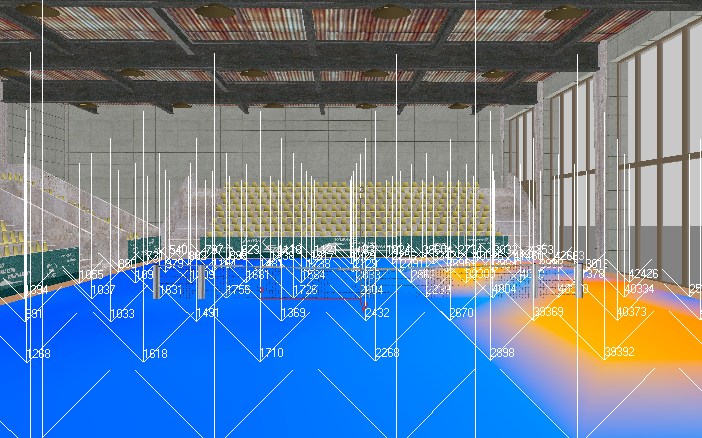
Light meter readings showing improved color coded feedback
The orange areas of the tennis court interior show direct sunlight for this time of day, while the blue areas show indirect sunlight.
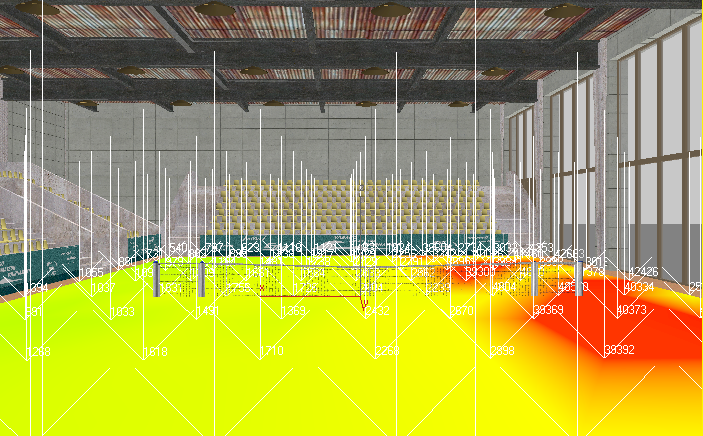
Scale drop-down list, choose Logarithmic.
The color-coded areas update to provide a different visualization of the light intensity, but the intensity values themselves remain unchanged.
 render the scene.
Computers with average processing capabilities will typically take five minutes or so to complete this task.
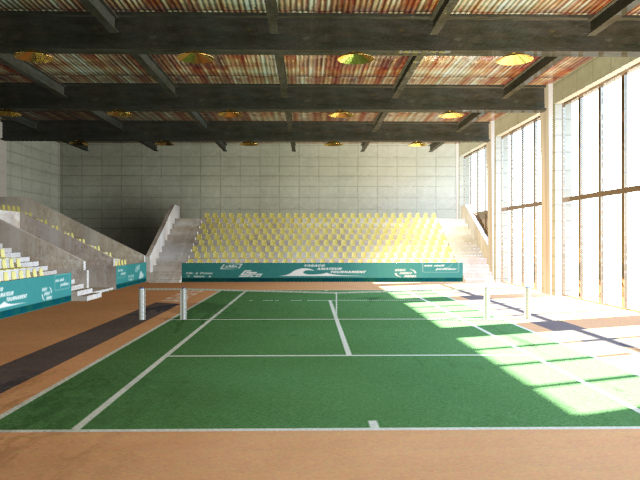
Rendered interior scene showing mid-afternoon illumination
The Perez All-Weather Sky model and weather data provide bright scene illumination. Some image detail near the windows is washed out, but the interior shows up in good detail.


