Use the Profiling Center to monitor scene performance and pinpoint where performance cost is highest. You can access the
Profiling Center from the Window menu.
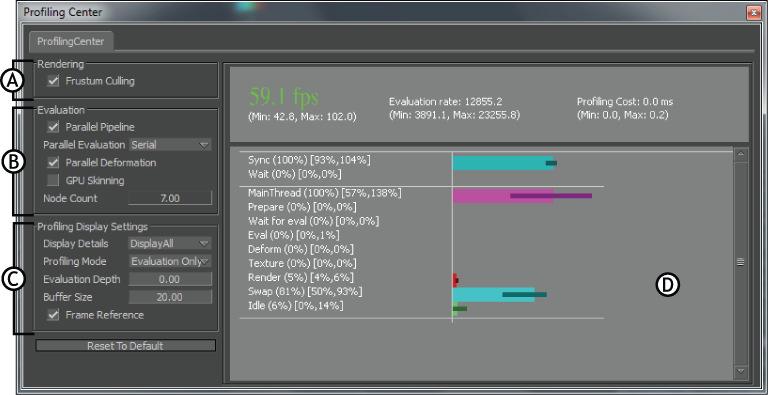
The Profiling center is divided into four main areas:
Rendering options
-
-
When active, Frustum Culling will prevent the rendering of anything outside the confines of the Viewer window. This option
is turned on by default. When this option is turned on, it appears in the evaluation line of the performance statistics, which
can be displayed in the Viewer window by using the Shift-F keyboard shortcut.
Tip
Use Ctrl-Shift-P to toggle the Frustum Culling setting on and off.
Evaluation options
Set the Parallel Evaluation to one of the following options:
NoteToggle between the Parallel Evaluation options by using the keyboard shortcut Ctrl-Shift-J.
-
-
Evaluates tasks consecutively.
-
-
Evaluates nodes in a scene based on model hierarchy. Constrained objects will not be multi-threaded.
-
-
Evaluates nodes in a scene including all dependencies.
-
-
Evaluates deformation in parallel with other tasks. This option is turned on by default.
-
-
Allows you to switch between CPU and GPU skinning. GPU skinning is disabled by default on machines with four or more cores.
Tip
Use Ctrl-Shift-D to toggle the GPU Skinning setting on and off.
-
-
Displays the number of scene nodes being evaluated for each cycle.
Profiling Display Settings
Select from the following Display Details options to customize the Profiling display:
-
-
Shows a list of all the processes in the Profiling display.
-
-
Shows only the Eval process in the Profiling display.
-
-
Shows the Render process in the Profiling display.
-
-
Shows only the Devices process in the Profiling display.
Select from the following Profiling Mode options to customize the Profiling display:
-
-
All profiling is disabled, including Viewer profiling
-
-
Collects profiling for all known evaluation tasks. This is the default mode.
-
-
Collects profiling for all known rendering tasks.
-
-
Collects profiling for device input, device output and device evaluation.
-
-
Collects profiling for SDK.
-
-
Collects profiling for all known tasks that don't increase with scene size. For large scenes selecting this option will not
influence performance.
-
-
Collects profiling for all known tasks. For large scenes selecting this option will influence performance.
-
-
This option can be set to any value between zero and ten.
- Zero is a base level evaluation that is not dependant on a profiling mode.
- Ten is the deepest level of profiling available. Setting this depth could affect performance.
-
-
Setting this option to a value between zero and 200 denotes the sample size of evaluation cycles.
-
-
Toggle between two profiling time displays. Enabling this option shows profiling time in MS. Disabling this option shows profiling
time in reference to one frame.
-
-
Restores the default settings that are in the config file.
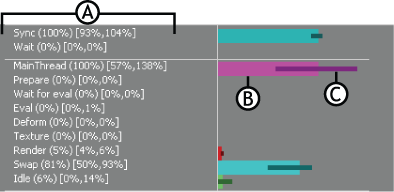
Profiling display
The Profiling display contains a list of tasks and a visual representation of the time that is spent performing a task cycle.