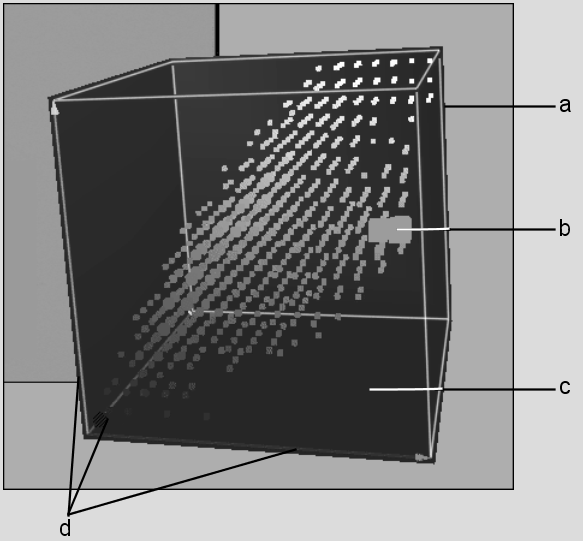
The RGB viewer is a 3D colour model for the key-in clip. Its X, Y, and Z axes represent the red, green, and blue components of the key-in clip's colour space. The cubes of colour show the distribution of all the colours of the key-in clip in RGB colour space. This 3D colour map is referred to as the 3D histogram.


(a) The colours in the key-in clip are represented by the colour cubes of the 3D histogram (b) More prevalent colours are represented by larger cubes (c) Black canvas background (d) Red, green and blue axes
When you scroll through a clip, the 3D histogram cubes update to display the colour distribution of each frame.
Use the 3D histogram to analyse the colour mapping of the key-in clip and to locate the colours to be keyed out. When you sample for tolerance and softness, the sampled areas are represented as ellipsoids in the RGB viewer. You can manipulate sampled objects in the viewer to fine-tune the key. When you plot a colour to key in the image, its location is plotted in the RGB viewer.
You can turn the display of the histogram and the black canvas background on and off and set options to control their appearance. Change the display any time as you create the key to help you best visualize the contents of your image and work with the RGB viewer. To learn more about controlling the display of the RGB viewer, see Setting the 3D Histogram Display.