As you work with sampled elements in the RGB viewer, set the display of the 3D histogram, canvas background, and border lines to suit the operation you are performing. For example, when modifying the softness range, consider hiding the 3D histogram to see the softness ellipsoid more clearly.
Setting the 3D Histogram Display
The 3D histogram provides a visual representation of the colours in the key-in clip. It shows how the colours in your clip are distributed in RGB colour space. The most prevalent colours are represented by larger cubes; colours that are less prevalent are represented by smaller cubes.
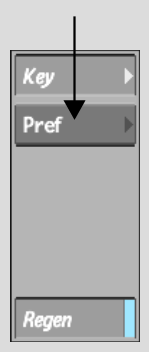
Change the display of the histogram using the Preferences menu. To access the Preferences menu, click Pref.


HistogramShows or hides the histogram. Alternatively, use the H hot key.
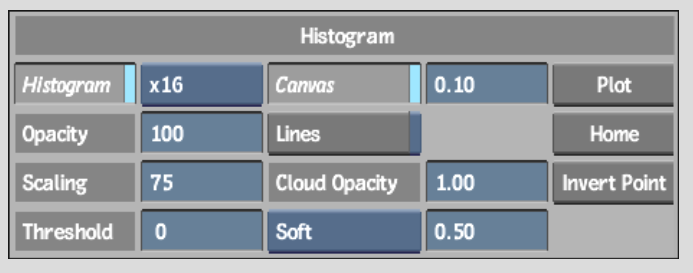
Histogram gridDisplays the resolution for the cubes:
Opacity fieldAdjusts the opacity of the cubes. As you adjust the opacity, smaller cubes become transparent at a faster rate than larger ones. The default setting is 100% opacity.
Scaling fieldResizes the cubes. Cubes representing less prevalent colours (the smaller cubes) are scaled down more than those representing more prevalent colours. The cube of the most prevalent colour remains the same size (as set in the Histogram Grid box). By increasing the size difference between the colours of greater and lesser prevalence, you can see the main components of the colour space more clearly.
Threshold fieldRemoves the display of colours that are less prevalent in the image. As you increase the threshold, less prevalent colours are increasingly removed from the histogram.
The canvas is the black background of the RGB viewer. Control the display of the canvas using the Preferences menu.

(a) Canvas button (b) Canvas Light field
Canvas buttonShows or hides the canvas. Alternatively, use the C hot key.
Canvas Light fieldSets the lighting in the RGB viewer. The light source emanates from behind the viewer.
You can show or hide a white outline of the borders of the RGB viewer, as well as green wireframe boxes around selected ellipsoids. Show the boxes to quickly identify the selected element, or hide them to reduce “clutter” in the viewer.
To show or hide lines in the RGB viewer:


