To scale a region of curves using Manipulator Scaling
A white box with handles at its corners (the manipulator box) appears in the graph view, bounding the selected region.
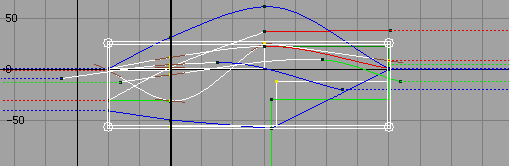
If you want to reposition the region,  -drag
the manipulator box.
-drag
the manipulator box.
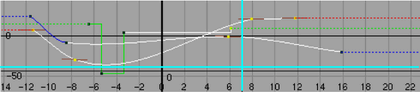
To scale a region of curves using Gestural Scaling
-click
where you want to insert the scaling pivot point. Drag the cursor
horizontally to scale the time values of the region. Drag vertically
to scale the value information of the region.
A horizontal and vertical solid line intersect in a box to indicate the pivot point of the scaling action.