


In this lesson, you will learn how to export your Light Meter readings so that others can view them either in an Excel spreadsheet, or as a rendered image overlayed with Light Meter data.
 open arena_03.max.
Export the Light Meter data in spreadsheet format:
 select the Light Meter helper object.
 Modify panel
  Display rollout and click Export To CSV File.
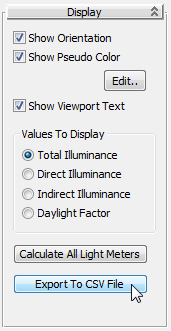
3ds Max Design saves the data generated by the Light Meter object in CSV format to the \export folder of your project directory.
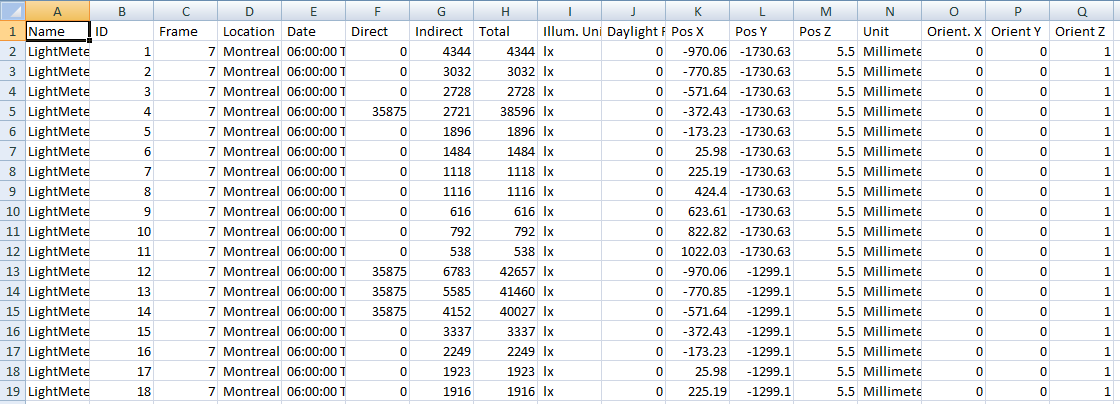
The file opens in an Excel spreadsheet, showing light data gathered by each point in the Light Meter helper. This data, formulated for technical specialists such as lighting engineers, is described in detail in the following table.
| Column | Definition |
|---|---|
| A: Name | Name of the Light Meter helper. |
| B: ID | Number of the Light Meter helper sampling point. |
| c: Frame | Number of the frame in an animated sequence where the light source was sampled. (A value of 0 indicates no animation.) |
| D: Location | Geographic location of the scene. |
| E: Date | Time and date on which weather data used by the lighting source was recorded. |
| F: Direct | Value of direct illumination detected by the Light Meter sampling point. |
| G: Indirect | Value of indirect illumination detected by the Light Meter sampling point. |
| H: Total | Combined value of direct and indirect illumination detected by the Light Meter sampling point. |
| I: Illum. Units | Unit of measurement used to display light illumination values in columns F through H (lx = lux, fc = foot-candles). |
| J: Daylight Factor | Value of daylight detected by the Light Meter sampling point, excluding direct or indirect luminance. |
| K-M: Pos X/PosY/Pos Z | Position coordinates of the Light Meter sampling point. |
| Unit | Unit of measure used to display the Light Meter sampling point position in columns K through M. |
| O-Q: Orient X - Z | Rotation coordinates of the Light Meter sampling point. |
 Close the Excel spreadsheet.
Lighting Analysis Assistant to open the Lighting Analysis Assistant dialog.
Close the Excel spreadsheet.
Lighting Analysis Assistant to open the Lighting Analysis Assistant dialog.
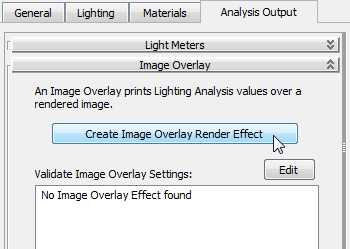
3ds Max Design opens the Environment And Effects dialog Effects panel.
Display Options group, make sure all the options are turned on. Keep the dialog open.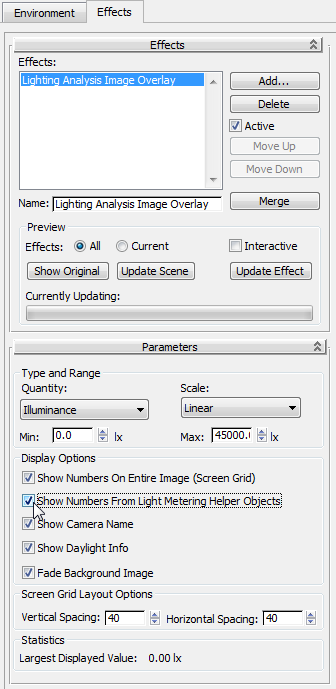 Preview group, turn on Interactive.
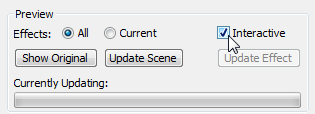
3ds Max Design renders the scene.
As soon as the calculation is complete, two rendered frames display.
The first frame renders entirely in yellow. It is used to create the overlay image but contains no usable information. Close this window.
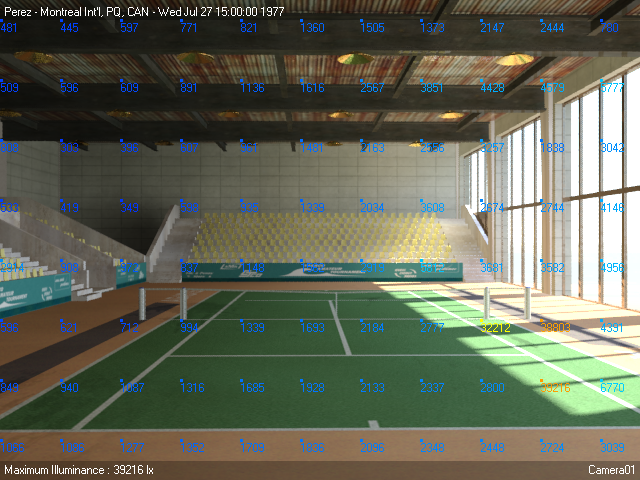
The second rendered frame includes a layer of luminance data derived from the lighting analysis. The numbers are dense and not easy to read because they include lighting values in a grid, as well as values generated by the Light Meter sample points.
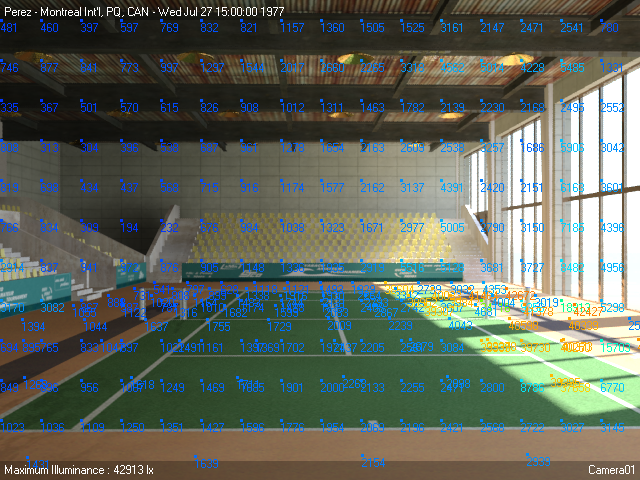
Overlay shows combination of grid and sample point light meter data
Adjust the display of Light Meter data:
Parameters rollout Display Options group, turn off Show Numbers On Entire Image (Screen Grid). 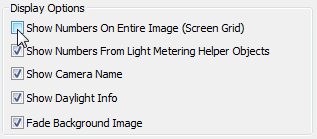
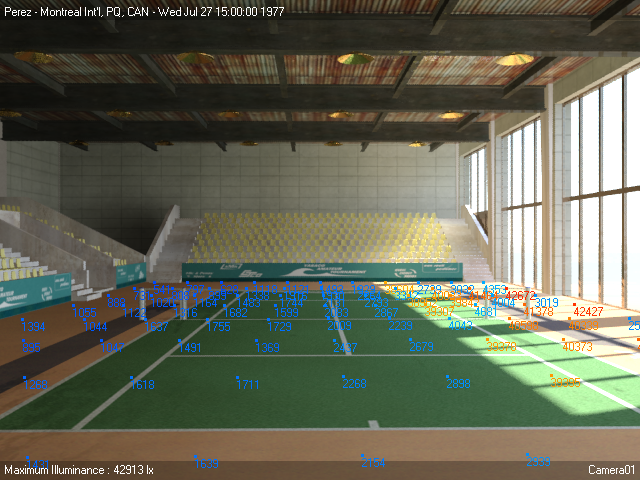
Now only the luminance values returned by the sampling points of the Light Meter you created for the court surface are displayed.
The rendering updates instantly after you make your choice because you turned on Interactive in the Effects rollout Preview group.
Notice how the maximum luminance values display in the lower-right corner of the rendered frame.
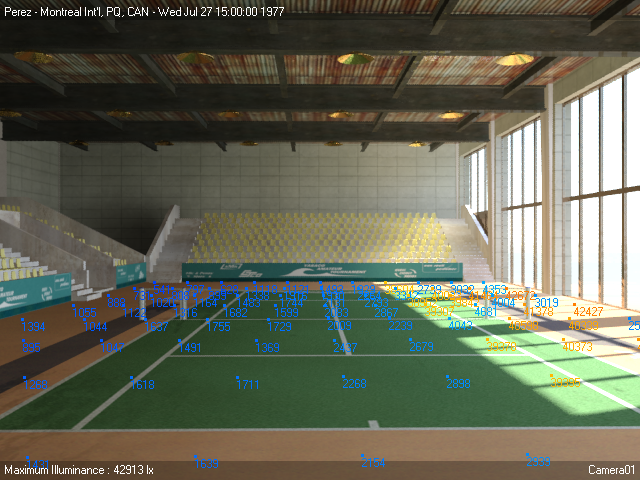
Overlay shows sample point light meter data only
Effects panel Parameters rollout Type And Range group, change the value of Max to 42927.0, and then press Enter.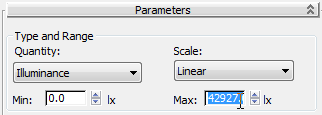
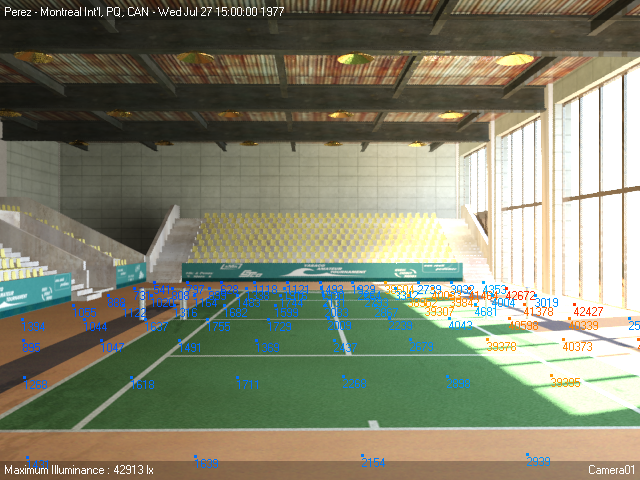
By lowering the maximum range, the sample values display in their full color-coded range, from blue (low luminance) to red (high luminance). This is most noticeable near the windows.
The scene shows the actual light intensity of the rendered image. This, however, makes the Light Meter data harder to read.
The Light Meter luminance data is now sampled from 2D points on the image surface. You can set the density of sampling points on the surface plane.
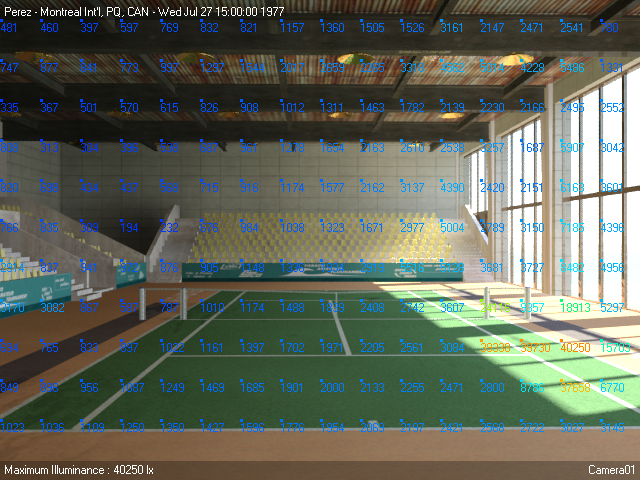
Overlay shows light meter data arranged in a 40 by 40 grid
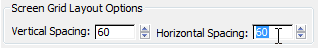
Increasing the spacing decreases the density of the grid.
 Preview group, click Show Original to view the scene without the lighting data. Click Show Effects to redisplay the data.
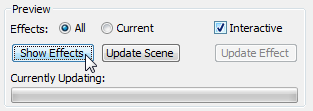
 (Save Image).
With the Save Image dialog, you can save the rendered image in a number of formats to a location of your choosing.
If you like, you can view a completed version of this lesson by opening the scene file arena_completed.max.
In this tutorial, you learned how to create a Daylight system and set the exposure to effectively illuminate an indoor scene. You then opened the Lighting Analysis Assistant and prepared the scene for lighting analysis using a helper object called a Light Meter, which evaluates the amount of direct and indirect illumination that enter a scene.
You also learned how to introduce realistic lighting conditions by downloading weather data containing real-world meteorological observations, and applying these luminance values to your Daylight system. You then took the Light Meter readings generated by the new luminance values, and converted them into spreadsheets and rendered overlays for subsequent analysis.