Color Correct


| Master CC | Shadow CC | Midtone CC | Highlight CC | Luma Regions | Mask | Output

Adjusts the colors in a clip. For example, you can change the hue, contrast and saturation of the whole image, or just the areas of shadow, midtones and highlights.

Requires an Input (RGB or RGBA).

Can optionally take a Comparison (RGB or RGBA).

Produces an Output (RGB or RGBA).

NoteColor modifications in HSV or HLS space are not compatible with unclamped color values in floating-point (HDR) images.

Master CC

Master CC applies Color Correct to the entire image. Any values changed in Master CC will be applied to the shadows, midtones and highlights, and so will affect the values in Shadow CC, Midtone CC and Highlight CC.

HSV

Color Wheel

Lets you perform a hue shift. The color wheel has two parts, a fixed inner part and a moving outer wheel. Drag clockwise or counterclockwise to map the input hues on the inner wheel to those on the outer portion. The value in the Shift field changes as you rotate the color wheel.

Hue Shift

Lets you perform a hue shift. Enter a value between -1 and 1 using the slider. As you change the hue shift, the new hue mapping is reflected on the color wheel. A positive value rotates the color wheel clockwise, a negative value rotates the color wheel counterclockwise.

Sat Level

Saturates or desaturates the hues in the image. Use the slider to set a value between 0 and 10; the default value of 1 leaves the saturation unchanged.

Offset

Offset lets you set the intensity of tint for your image. The current tint value is represented by an 'x' in the color wheel. By default, offset is 0 (no tint). This is represented by black in the color wheel. Set any value between 0 and 1 (full intensity).

Gain

Gain lets you set the tint color for your image. The current tint value is represented by an 'x' in the color wheel. Set any value between 0 and 1, which indicates a position around the color wheel.

Matrix

The matrix is used to map input values to output values. For any given red, green, blue value, the output for each component is determined by summing the product of each input component and the appropriate multiplier from the output channel.

R to R

Controls the degree to which red input values are remapped to red output values.

R to G

Controls the degree to which red input values are remapped to green output values.

R to B

Controls the degree to which red input values are remapped to blue output values.

G to R

Controls the degree to which green input values are remapped to red output values.

G to G

Controls the degree to which green input values are remapped to green output values.

G to B

Controls the degree to which green input values are remapped to blue output values.

B to R

Controls the degree to which blue input values are remapped to red output values.

B to G

Controls the degree to which blue input values are remapped to green output values.

B to B

Controls the degree to which blue input values are remapped to blue output values.

Luma

Used to remap component values by adjusting Gamma, Gain, Offset and Contrast for the image's Luma component.

You can see the changes to the component's curve in the graph at the bottom of the tab.

Red

Used to remap component values by adjusting Gamma, Gain, Offset and Contrast for the image's Red component.

You can see the changes to the component's curve in the graph at the bottom of the tab.

Green

Used to remap component values by adjusting Gamma, Gain, Offset and Contrast for the image's Green component.

You can see the changes to the component's curve in the graph at the bottom of the tab.

Blue

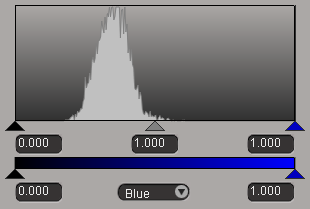
Used to remap component values by adjusting Gamma, Gain, Offset and Contrast for the image's Blue component.

You can see the changes to the component's curve in the graph at the bottom of the tab.

Histogram

Allow component remapping for ranges of values outside of the specified thresholds. Thresholds can be set for RGB components individually, as well as for the Luma. A single color can also be suppressed.

Component Menu

Selects the component, or luma, to be manipulated. Select Red, Green, Blue or Luma. The menu shows the last selected option.

Histogram

The histogram can be used to implement a component level mapping process, using the parameters in the boxes at the four corners of the histogram, or the triangles.

Component levels are placed on the horizontal axis, and the number occurrences of each component level are placed on the vertical axis. The bar underneath the histogram graph represents the output values to which the input values are mapped.

You can remap values by sliding the triangles at the bottom of the graph an on the bar, or by entering new values in the corresponding boxes.

Input Minimum: Input Minimum is the boundary value between the region where all input values are mapped to the output minimum value (to the left) and the region where input values are mapped one-to-one to output values (to the right).

Type a number in the top left-hand box of the histogram display and press Enter, or slide the triangle in the lower-left hand corner of the histogram graph to the desired value.

Input Maximum: Input Maximum is the boundary value between the region where input values are mapped one-to-one to output values (to the left) and the region where all input values are mapped to the output maximum value (to the right).

Type a number in the top right-hand box of the histogram display and press Enter, or slide the triangle in the lower-right hand corner of the histogram graph to the desired value.

Output Minimum: Output Minimum is the output value that all input values below the Input Minimum are mapped to.

Type a number in the bottom left-hand box of the histogram display and press Enter, or slide the triangle on the left side of the output bar to the desired value.

Output Maximum: Output Maximum is the output value that all input values above the Input Maximum are mapped to.

Type a number in the bottom right-hand box of the histogram display and press Enter, or slide the triangle on the right side of the output bar to the desired value.

Gamma: Performs a gamma adjustment on the selected component.

Type a number in the middle box of the histogram display and press Enter, or slide the gray triangle in the lower middle of the histogram graph to the desired value.

Graphs

Graphs

Contains four color component levels and a luma remapping curve on one graph. Input component and luma values are displayed along the horizontal axis and mapped by the response curve to the new output values along the vertical axis. Select the curve you require from the buttons at the top of the graph.

Suppression

Suppress

Suppresses the selected color from the image. Among other things, this is useful for removing blue spills from a blue-screen composite.

Shadow CC

Shadow CC is equivalent to Master CC but lets you color correct the dark areas of your image. The Suppression tab is not present on this page.

Midtone CC

Midtone CC is equivalent to Master CC but lets you color correct the Midtones in your image. The Suppression tab is not present on this page.

Highlight CC

Highlight CC is equivalent to Master CC but lets you color correct the high luminance regions in your image. The Suppression tab is not present on this page.

Luma Regions

Lets you select which luma areas of your image are displayed. These areas are defined by the Luma Graph. Luma Region can be either Composite, Shadow, Midtone, or Highlight.

Graphs

The luma graph contains three luma remapping curves Shadow, Midtone and Highlight. These graphs determine the luma values that are considered part of each area. By default, the Shadow graph selects areas of low luminance and the Highlight graph areas of high luminance. Input luminance values are shown along the horizontal axis. The output values on the vertical axis indicate the value used for that region. Select the curve you require from the buttons at the top of the graph.

Shadow lets you change the darkest areas of your image.

Midtone lets you change the midtone areas of your image.

Highlight lets you change the areas of highest luminance.

Output

Displays the Shadow, Midtone, or Highlight component of the output image, or a composite of all three.

Composite displays the output image.

Shadow displays a luma of the dark areas of the image. The areas of greatest shadow are shown at full luma, that is, are shown as white. The areas of highest luminance are shown as black.

Midtone displays a luma of the midtone areas of the image. Midtone areas of the image are shown at highest intensity, that is, are shown as white.

Highlight displays a luma of the light areas of the image. The highest luminance areas of the image are shown as white.

Mask

Controls this operator's Mask Options.

Output

Controls this operator's Output Options.

Creative Commons License Except where otherwise noted, this work is licensed under a Creative Commons Attribution-NonCommercial-ShareAlike 3.0 Unported License