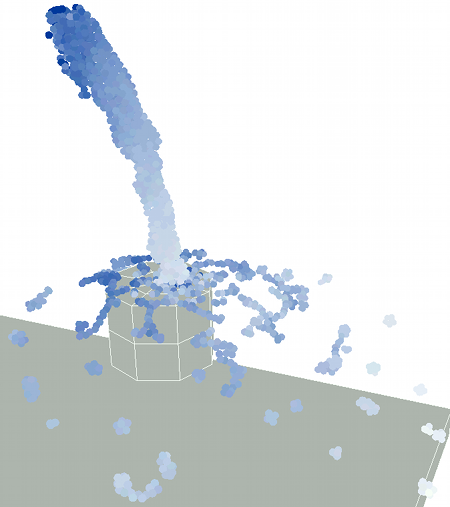
Maps a color gradient to different element data that is calculated in the simulation framework.
Plug the Set Color output into the Set Color port of the Material node; plug the Color output into any Color port, such as in the Material node.
You can also select a point cloud and choose Particles  After Emission
  Lagoa Particles
  Color from Gradient Data from the ICE toolbar to have this node set up in the point cloud's ICE tree.

The Lagoa Gradient Data node plugged into the Lagoa Phase node, with the Data option set to Velocity.
Output Ports: Set Color, Color
| Data |
The type of element data for which you want to display a color gradient: Density, Velocity, or Stress. |
| Gradient Color |
The color gradient used for the particle Data based on the Min/Max values below. See the Gradient node for more information. |
| Gradient Range |
Fits the gradient range to the point cloud:
For example, let's say that density is from 0 to 2 on the solver steps, but you want to map a gradient that fits the density from 1 to 2. If you set the Min/Max values to 1/2, the density values below 1 are mapped to the leftmost color on the gradient. |
| Min |
The minimum Data value to be affected by the color gradient. This value corresponds to the leftmost color on the gradient. |
| Max |
The maximum Data value to be affected by the color gradient. This value corresponds to the rightmost color on the gradient. |