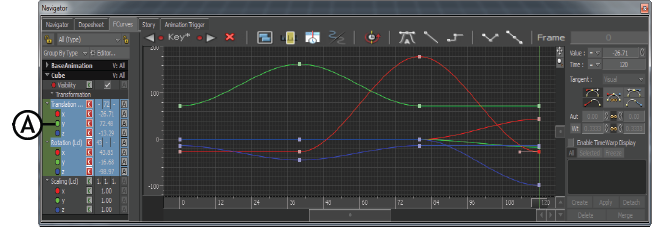
Using different colors can make it easier to distinguish between different properties. For example, the Y values of translation, rotation, and scaling curves appear in the same color by default. Changing the color of the Y translation curve differentiates it from the Y rotation and scaling curves.
To change the color of a function curve:
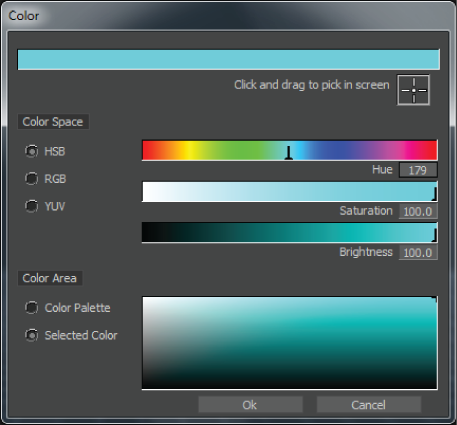
For more information see Color window.
The color of the function curve for the selected property is changed in the FCurves pane.
You can also right-click a property in the property tree and select one of the following context menu options:
| Option | Function |
|---|---|
| Edit Curve Color | Displays the Color window to allow you to change the color of a function curve. |
| Edit All Curve colors of this type | Displays the Color window to allow you to change all curves of the same type to the color. |
| Reset Curve color | Restores the color of the selected curve color to its default colors. |
| Reset All Curve colors | Restores all curve colors to their default colors. |
 Except where otherwise noted, this work is licensed under a Creative Commons Attribution-NonCommercial-ShareAlike 3.0 Unported License