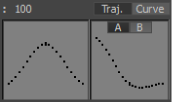
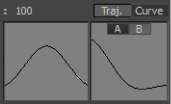
The animation representation area displays the changes you make to animation. The area on the left represents the peak of the trajectory or curve of the animation. The area on the right represents the slopes of the trajectory or curve of the animation. See A and B options for more information.
You can also choose to have representations of the animation display as trajectories, curves, or both.

Animation representation area A. Animation representations B. Trajectory option C. Curve option D. A and B options
Since you can manipulate many different trajectories and curves at once with the Dynamic Editor, the trajectories and curves that display in the window represent the changes you make, not the actual trajectories and curves you are modifying.
To see the changes you make to the trajectory of your animation, look in the Viewer window. To see the exact changes you make to the curves of your animation, look in the FCurves window.
The Trajectory option lets you show or hide the trajectories, which display as dotted lines in the animation representation.

Animation displayed as a trajectory
A trajectory is a path of animation through space. For example, in the previous figure, the cube’s trajectory in the Viewer window is similar to the trajectory representation in the Dynamic Editor.
The dots represent motion through time, and display close together or far apart depending on the velocity of the animation.

Animation A. Trajectory representation B. Actual trajectory
The Trajectory option can be active at the same time as the Curve option, so you superimpose curve and trajectory representations.

Trajectories (dotted lines) and curves (solid lines) displaying animation
The Curve option lets you show or hide the animation curves, which display as solid lines in the animation representation.

Animation displayed as curves
A curve represents animation through time, similar to what you would see in the FCurves window.

Animation A. Curve representation B. Actual function curve of the animation
The trajectory of the animation as seen in the Viewer window can be different than its curve.

Animation A. Curve and trajectory representation B. Actual trajectory in the Viewer window
The Curve option can be active at the same time as the Trajectory option, so you can superimpose trajectory and curve representations. See Trajectory (Traj.) option for more information.
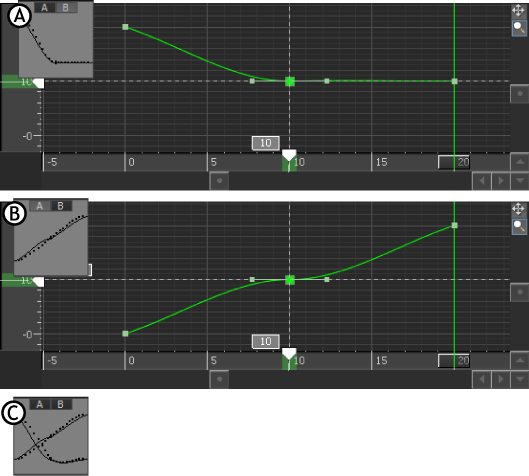
The A and B options let you show or hide different representations of trajectories and curves.
The A option lets you show or hide the representation of a function curve that descends and then plateaus.
The B option lets you show or hide the representation of a function curve with an incremental slope that can have a pause in the middle. Both options can be active at the same time to display both representations.

Animation representation A. The A representation. B. The B representation C. A and B representations superimposed