To normalize your animation curves
The Graph Editor appears with all the animation curves for the selected objects displayed in the graph view.
 ).
).
All the curves currently displayed in the Graph Editor’s graph view are scaled to fit within a range of -1 to 1. Only the displayed curves are scaled, not the underlying animation.
To turn off normalized curve display
The Graph Editor appears with all the animation curves for the selected objects displayed in the curve view.
 ).
).
The curves in the Graph Editor graph view return to their original display.
 ).
).
All the selected curves currently displayed in the Graph Editor’s graph view are scaled to fit within a range of -1 to 1. Only the displayed curves are scaled, not the underlying animation.
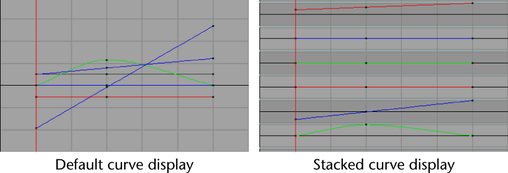
By default, curves are displayed overlapping in the graph view. You can switch to view a stack of individual curves.

To view a stacked display of curves
 to open the Stacked Curves Options window and set additional display options.
See also Stacked Curves for more information.
To turn off stacked display of curves
You can limit which curves display in the graph view for a selected channel.
To have only directly connected curves display in the graph view
To have all curves display again for the selected channel
 Except where otherwise noted, this work is licensed under a Creative Commons Attribution-NonCommercial-ShareAlike 3.0 Unported License