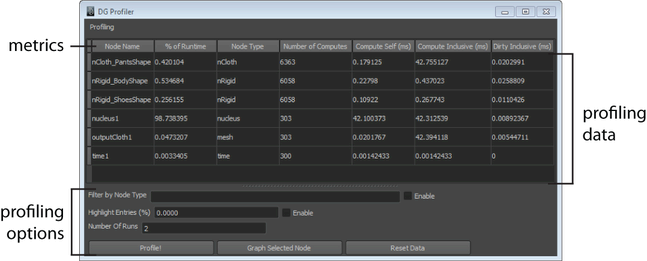
The generates profiling data for all nodes included in the dependency graph. This tool collects a variety of timing metrics for
each node based on the iterations specified. When profiling is complete, the generated data can be exported into a spreadsheet
for further analysis.
Metrics
-
-
-
-
A value that represents the node's compute self time as a percentage of the total time.
-
-
-
-
The number of times the node's compute was executed.
-
-
The compute self time measured in milliseconds.
-
-
The compute inclusive time measured in milliseconds.
-
-
The dirty inclusive time measured in milliseconds.
Profiling options
-
-
Filters profiling data by node type. After entering a node type in the field, select to filter the data. Deselect to turn node type filtering off.
-
-
Highlights entries included in the profiling data based on a specified value. Select to highlight all entries that have a value equal to or greater than the value entered in the field.
-
-
Specifies the number of iterations Maya performs before profiling data is generated.
-
-
Starts the profiling process.
-
-
Displays the input and output connections for the selected node in the . See
The Hypergraph.
-
-
Clears the profiling data from the .
 Except where otherwise noted, this work is licensed under a Creative Commons Attribution-NonCommercial-ShareAlike 3.0 Unported License