To interactively scale curves
- In the toolbar, select the Region Tool
 .
.
- In the graph view area, drag to select the region of curves you want to scale.
A rectangular selection box displays around your curves, with a manipulation handle on each side.
NoteTo change the background color of the selection box, open the () and adjust the color (on the tab, under the heading). See also
Change user interface colors.
- Drag the whole selected box to move the entire region, or drag the handles on each side of the box to expand and collapse
the box as follows:
- Drag horizontally to shorten or extend the region over time.
- Drag vertically to increase or decrease the range of values in the region.
By default, keys snap to whole values in time and in value.
To scale a region of curves using Manipulator Scaling
- Select the scale tool.
- In the window, set the scaling type to .
- Close the window.
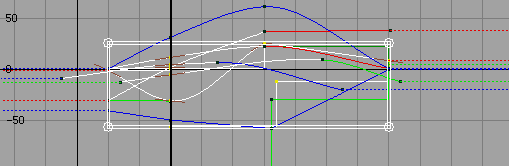
- In the ’s graph view, drag around the region you want to scale.
A white box with handles at its corners (the manipulator box) appears in the graph view, bounding the selected region.
If you want to reposition the region,  -drag the manipulator box.
- Drag the manipulator box by the corner handles to stretch and compress the contents of the region.
Note
- The curve segments adjacent to the region being scaled are altered as you use the manipulator.
- You can move blocks of keys by -dragging within the region of the manipulator box.
To scale a region of curves using Gestural Scaling
- Select the scale tool.
- In the window, set the scaling type to .
- Close the window.
- In the ’s graph view, drag around the region you want to scale.
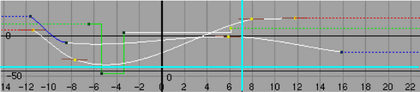
- -click where you want to insert the scaling pivot point. Drag the cursor horizontally to scale the time values of the region.
Drag vertically to scale the value information of the region.
A horizontal and vertical solid line intersect in a box to indicate the pivot point of the scaling action.