Presents a graphical view of the scene hierarchy or dependency graph, with boxes representing nodes and lines representing relationships.
You can enter syntax to limit the node listing in your Hypergraph panel. The syntax is case-sensitive. Every listed child node is displayed with its corresponding parent node even if the parent node would not otherwise be shown because of the filter.
For example, P* shows only the nodes beginning with the letter P.
The graph area shows the network of boxes representing nodes, and lines connecting them representing relationships. You can use the Hypergraph to view and edit hierarchical relationships or dependency relationships (input and output connections between attributes).
Use the camera move keys ( +
+  and +
and +  ) to move around the graph the same way you move around in view panels.
Contains options to manage assets.
Adds a new asset with Transform node to the graph area and adds any selected nodes to it. For more information see Assets > Create Asset with Transform.
Adds a new advanced asset node to the graph area and adds any selected nodes to it. For more information, see Assets > Advanced Assets > Create.
Lets you set an asset in the scene as the current asset. For more information see Assets > Set Current Asset.
Deletes the selected asset node from the Hypergraph. Any nodes within the selected asset are moved out of the asset before it is deleted.
When the asset node is nested within one or more other asset nodes, the nodes within the asset are moved one level up in the hierarchy.
To delete an asset node and its contents, press the Delete key.
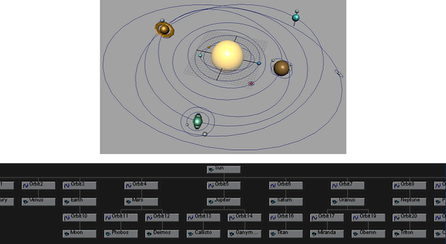
Lets you import and adjust the position of an image that displays behind the nodes within your Hypergraph panel when displaying in either the dependency graph mode (input/output connections) or for scene hierarchy mode when set to Freeform display.
Background images can be displayed in both scene hierarchy and input and output connections display modes. You can only use image formats accepted by Maya. For more information, see Supported file formats.
Background images are saved when using the Bookmarks feature.
The scene hierarchy is the grouping of child nodes under parent nodes. For more details, see Scene hierarchy.
You can show Input and Output connections to a selected node. An Input connection is a node that provides input to the selected node. An Output connection is a node that receives input from the selected node.
To see connections to most objects, you must select the shape node of the object rather than the transform node.
When you display output connections for a node, you see the chain of nodes that output to each other, all the way through to the end receiving node.
You create a wine glass surface by revolving a NURBS curve. The following dependency graph appears when you select the revolved surface’s shape node and select Graph > Input and Output Connections:
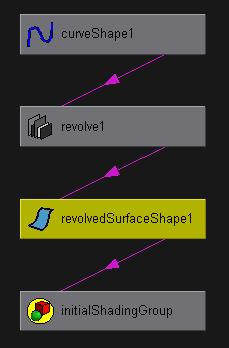
The connection lines between nodes show connection direction. The connection line originates at a node that outputs data, and the line points to a node receiving the data as input.
The example graph shows that a curve provides input to the revolve operation node. The revolve operation generates a revolved shape—the wine glass. The revolved shape is connected to initialShadingGroup, which sets the default color of all geometric shapes created in Maya.
If you move your mouse pointer over a connection line, small white boxes appear next to the input node and output node. The white box next to an input node shows the node’s name and attribute that receives the input.
The white box next to an output node shows the node’s name and attribute that provides the output. Each node name and attribute is separated by a period.
In many cases, you must be familiar with Maya’s internal operation details to understand the node and attribute names you see in the white boxes.
The dependency graph and scene hierarchy display animated nodes as slanted boxes. If you animate a node with an expression, it displays a regular rectangle rather than a slanted box. All other animation techniques display a slanted box. Specifically, a slanted box indicates Ball has a param curve connected to it.
Keyframe the translateX attribute of a NURBS sphere named Ball. If you select Ball’s transform node and display all Input and Output Connections, this graph appears:
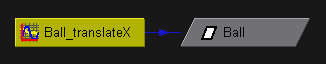
The slanted box indicates Ball’s transform node has been animated. The graph doesn’t indicate which type of animation technique controls the attribute.
See the following table for an explanation.
| Default Color | Attribute Type | Example Attributes |
|---|---|---|
| Blue | Single | transform.translateX, makeNurbsSphere.radius |
| Cyan | Double | file.repeatUV, cameraShape.cameraAperature |
| Green | Triple | transform.translate, lambert.color |
| Magenta | Data | nurbsSurface.create, makeNurbsSphere.outputSurface |
| Red | Array | particleShape.position, particleShape.velocity |
You can change these default colors in the Colors window (Window > Settings/Preferences > Color Settings).
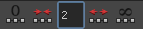
You can limit the number of nodes graphed in the connection mode of the Hypergraph. By default, depth traversal is unlimited (set to -1).
Use the Hypergraph > Graph > Increase Depth Traversal and Hypergraph > Graph > Decrease Depth Traversal to increase or decrease the depth traversal. You can also use the arrows or enter an integer into the numeric field of the Hypergraph menu bar to change the depth traversal value. Click the Unlimited button or set the number to -1 to remove the depth traversal limit.
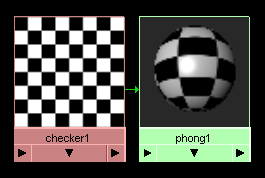
Suppose you create a NURBS sphere, then use the Hypershade to create and assign a Phong shading group to it. Next you use the Hypershade to create a 2D checker texture and assign it to the Phong node.
The Hypershade displays the following contents:
The following dependency graph appears when you select Rendering > Show Shading Groups in the Hypergraph.
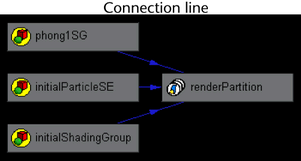
The connection lines between nodes show connection direction. The connection line originates at a node that outputs data, and the line points to a node receiving the data as input. The example above shows that the flow of output goes from the phong1SG shading group to the renderPartition.
Although you can see most of the same nodes in the Hypershade, the dependency graph shows the nodes in a flow diagram. This makes it easy to see the connections between the nodes that make up a shading group.
If you glide the mouse pointer over a connection line, small white boxes appear next to the input node and output node. The white box next to an input node shows the node’s name and attribute that receives the input.
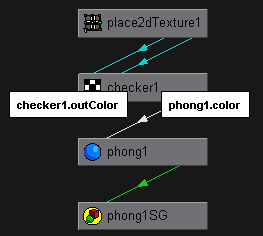
The white box next to an output node shows the node’s name and attribute that provides the output. Each node name and attribute is separated by a period, for example, checker1.outColor and phong1.color. In the preceding figure, the outColor attribute of checker1 is output to the color attribute of phong1.
In many cases, you must be familiar with Maya internal operation details to understand the node and attribute names you see in the white boxes.
By default, the scene hierarchy does not display shape nodes, hidden nodes, or underworld nodes. It displays only transform nodes—nodes that hold attributes and other information on an object’s transformation and parent-child relationships.
Shape node—holds an object’s geometry attributes or attributes other than the object’s transform node attributes. A shape node is a child of a transform node. A transform node has only one shape node.
Hidden node—any object hidden using Display > Hide from Maya’s menu bar. The default cameras top, front, side, and persp are also hidden nodes.
Underworld node—a pair of nodes below a shape node. When you create a curve on a NURBS surface, Maya generates an underworld transform node and shape node below the shape node of the surface. The CV positions of underworld nodes have UV coordinates on the surface rather than coordinates in world or local space.
A dotted line in the scene hierarchy indicates a connection to an underworld node. Connections to instanced objects are also indicated by dotted lines.
If you selectCreate > NURBS Primitives > Sphere to create a sphere, Maya creates a transform node and a shape node.
The sphere’s shape node holds the mathematical description of the sphere’s shape. The sphere’s transform node holds the sphere’s position, scaling, rotation, and so on. The shape node is the child of the transform node.
If you select Options > Display > Shape Nodes in the Hypergraph, the scene hierarchy shows these nodes for the sphere:
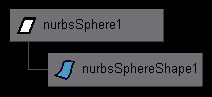
Maya gives the nodes the default names shown in the preceding figure. The transform node is nurbsSphere1, the shape node is nurbsSphereShape1. If you rename the transform node, for example, to Bubble, Maya renames the shape node to BubbleShape.
If you rename the shape node, Maya does not rename the transform node. Maya doesn’t transmit a child’s attribute changes up to its parent.
If you select Create > NURBS Primitives > Sphere to create a sphere, Maya creates a transform node and a sphere node. If you then select Modify > Make Live, then use the Create > CV Curve Tool to draw a curve on the surface of the sphere and turn on the display of shape nodes and underworld nodes, the scene hierarchy appears as follows:
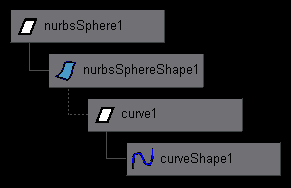
Maya gives the nodes the default names shown. The transform node is nurbsSphere1, the shape node is nurbsSphereShape1. The curve1 and curveShape1 nodes are underworld nodes for the curve created on the sphere’s surface.
When a curve-on-surface is hard to select in the workspace because of crowding or complex geometry, you can select it easily in the scene hierarchy with underworld nodes displayed.
You can display color-coded lines in the scene hierarchy that illustrate nodes connected by an expression, constraint, or deformer.
Create a NURBS sphere named Ball and a NURBS cone named Cone. Write an expression to assign the value of Ball’s translate Y attribute to Cone’s translate Y attribute. The expression links the two values. When you move Ball up or down in the view (in a Y-axis direction), Cone moves up or down the same amount.
If you select Options > Display > Expression Connections, the scene hierarchy displays this:
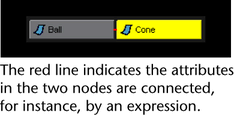
You can change the color-coding of the connection lines and other important entities by selecting Window > Settings/Preferences > Color Settings from Maya’s main menu bar and expanding Hypergraph/Hypershade.
The Hypergraph automatically updates the scene hierarchy when you add or delete an object, rendering node, or other item in the scene
When you select an object in the scene hierarchy or dependency graph, the object is also selected in the workspace, Outliner, and elsewhere in Maya. Also, when you select an object in the workspace, Outliner, and elsewhere in Maya, the object becomes selected in the scene hierarchy or dependency graph.
These updates slow Maya operation when you work with a complex scene or when you’re examining nodes or dragging nodes to new positions in a free-form hierarchy. You can turn off the updating option to improve operation speed.
Colors nodes in the Hypergraph based on their timed performance. Nodes with a 0 timing value appear grey, while nodes with a positive timing value are displayed in increasing shades from blue to red.
While you can set Heat Map Display on or off for individual Hypergraph windows, all Hypergraph windows are subject to the same set of Heat Map Display options.
For more information about the Heat Map Display, see Performance monitoring with the Heat Map Display.
Determines how custom thresholds affect the Heat Map Display.
Remap colors adjusts the color scheme relative to the current threshold instead of the highest/lowest timing value node.
Hide nodes automatically hides all nodes whose timing values are higher or lower than the Upper threshold and Lower threshold respectively.
Displays multiple connections between two nodes as a single, bold line. For more information, see Merge connections.