You can plot pixels in the key image and view the location of the pixel colour value in the RGB viewer. You can plot a single colour value or a range of colour values. These plotted areas do not affect the key at all—they simply identify colour values in the viewer.
You can plot a colour value to view its location in relation to key elements in the viewer. Additionally, you can employ a number of techniques to modify a key element in relation to a plotted colour value or range of values. For example, you could plot a colour value corresponding to an unwanted grey area in the foreground subject, and then translate or scale the softness ellipsoid such that the colour value is outside the ellipsoid.
Plotting a pixel in the key image sets the exact location of the colour value in the RGB viewer. The colour value is identified by a small, white wireframe cube in the viewer. As an alternative, you can use the Plot tool to select a colour value directly in the viewer by clicking on a 3D histogram cube.
If a key element in the viewer is selected before you plot the colour value, the element's directional arrow moves to point towards that colour. Plotting pixels in this way allows you to quickly refine the matte by translating or scaling a key element with respect to the plotted colour.
To plot a pixel on the key image:
If you have problems selecting the element, see Selecting Key Elements in the RGB Viewer.


In the RGB viewer, the colour value of the selected pixel is plotted and the arrow of the selected key element moves to point towards the plotted colour value.
If needed, rotate the viewer by pressing Ctrl and dragging it to get a better view of the key element with respect to the plotted value.
| Press: | To: |
|---|---|
| V-click | Sample pixels where you click in the image. The arrow is repositioned in the RGB viewer. Drag left or right to scale along this axis. |
| 6 and drag key element | Move the selected key element in the direction of the arrow. |
| 7 and drag key element | Rotate the selected key element in any direction around its centre point. |
| 8 and drag key element | Scale the selected key element proportionally from its centre. Drag left to scale down and right to scale up. |
| 9 and drag key element | Scale the selected key element in the direction of the arrow (non-proportionally) from its centre. Drag left to scale down and right to scale up. |
| 0 and drag key element | Scale the selected key element in the direction of the arrow (non-proportionally), starting from the point on the key element's surface where the back of the arrow remains anchored in place. |
As you move the key element away from the plotted pixel, you can see the effect on the key image or the matte.
To select a colour value in the RGB viewer:
If you have problems selecting the element, see Selecting Key Elements in the RGB Viewer.
Plot mode is activated and the cursor changes to a colour picker.
The selected cube is surrounded by a white wireframe box and the direction of the key element arrow moves toward the selected cube.
Plotting a Range of Colour Values
When you plot a range of colour values in the image, the resulting plotted region in the RGB viewer appears as a 3D convex hull. You can plot up to three colour ranges in the image. The plotted regions do not in themselves affect the key image in any way.
A plotted region allows you to compare the intersection of a key element with a particular colour range in the image, providing you with yet another alternative for adding precision to your key.
For example, use this tool to plot a colour range that you do not want to be softened. Using the plotting region as the reference, you translate and scale the softness ellipsoid away from the plotted region to ensure the softness precision of the key. Plotted regions also help you to determine whether or not to use a garbage mask. If a colour that you want to soften is the exact colour that you want key out, then you should apply a garbage mask.

A 3D convex hull appears in the RGB viewer.
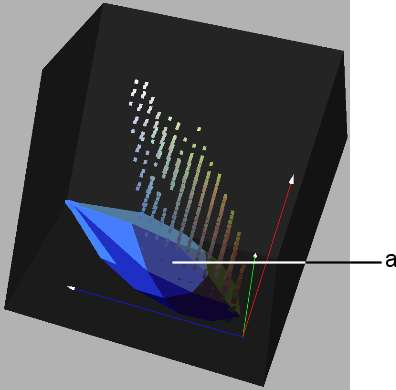
(a) Each vertex contributes to the convex hull that represents the plotted region.
Plotting Several RegionsYou can plot a second and third region, and compare the positions of the convex hulls. To plot a second region, use the procedure described above, selecting Plot 2 from the Sampling box and enabling the Plot Regions 2 button.
For example, sample one plot region in an area of the matte containing unwanted grey areas, and another plot region where the grey area is intentional. You can then observe where the colours of the two regions are the same (where the plotted regions intersect), and adjust the softness accordingly.
| To: | Do this: |
|---|---|
| Remove the grey areas from the foreground subject. | Move the softness key element away from the plotted region intersection. |
| Prevent the matte from becoming over softened or transparent. | Use a patch. |
| Keep part of the key that has the exact colour as the area being softened. | Use a garbage mask. |


