When you generate mattes, modify clips, or match colours between clips, you can sample colours in both the result clip and a reference clip. Use Plot to sample a colour from the result clip and Ref to sample one from a reference clip. The Plot and Ref buttons appear on every menu in the Colour Warper.
Samples appear in the histograms. In the 2D luma histogram, the Plot sample is represented by a red bar and the Ref sample is represented by a yellow bar.


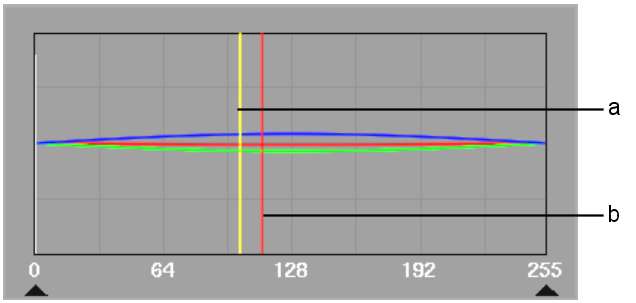
(a) Reference colour (yellow vertical line) (b) Plotted colour (red vertical line)
In the vectorscope, the Plot sample is outlined in red and the Ref sample is outlined in yellow.

(a) Plotted colour (outlined in red) (b) Reference colour (outlined in yellow)
You can use Plot to get more information on colours you want to change. When you are adjusting colours and levels and are not sure which controls to use, click Plot and select a colour in the image. You can then view the histograms to determine which control you should use. For example, if the plotted colour appears in the middle of the 2D luma histogram, you can modify the colour in the image using the Midtones trackball while viewing the plotted colour in the 2D vectorscope.
| You can: | To: |
|---|---|
| Click-drag | Sample a single pixel in the image. You can drag through the image until you locate the pixel you want to sample. |
| Ctrl-drag | Sample an average taken from a range of colours in the image. |
A red vertical line appears in the 2D luma histogram indicating the luma of the sample. The sampled colour is also outlined in red in the 2D or 3D vectorscope. In the 2D vectorscope, you see the sample in terms of hue and saturation. In the 3D vectorscope, you see it in terms of HLS. If you are plotting a colour in a 16-bit floating point image that is out of the 0:1 range, the red outline appears outside of the vectorscope.
| You can: | To: |
|---|---|
| Click-drag | Sample a single pixel in the image. You can drag through the image until you locate the pixel you want to sample. |
| Ctrl-drag | Sample an average taken from a range of colours in the image. |
A yellow vertical line appears in the 2D luma histogram and the sampled colour is outlined in yellow in the 2D or 3D vectorscope. If you are referencing a colour in a 16-bit floating point image that is out of the 0:1 range, the yellow outline appears outside of the vectorscope.


