As you work with sampled elements in the RGB viewer, set the display of the 3D histogram, canvas background, and border lines to suit the operation you are performing. For example, when modifying the softness range, consider hiding the 3D histogram to see the softness ellipsoid more clearly.
Setting the 3D Histogram Display
The 3D histogram provides a visual representation of the colours in the key-in clip. It shows how the colours in your clip are distributed in RGB colour space, with exposure and contrast settings taken into account. See Controlling Image Display using Exposure and Image Data Type.
The most prevalent colours are represented by larger cubes; colours that are less prevalent are represented by smaller cubes.
When a floating-point image is used as a key-in clip, the RGB Viewer will support this input and also activate options to change the display of colour space in the 3D histogram. These options are available in the Histogram panel of the Key menu. When the range in the histogram exceeds 1, a cube outline indicating the colourspace from 0 to 1 is displayed in the RGB viewer.


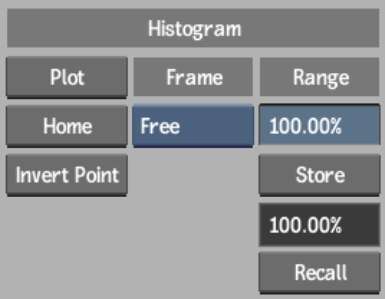
Frame option boxSelect an option to display the entire histogram, or a selected range of values.
| Select: | To display: |
|---|---|
| All Objects (Shift+A) | All objects in the 3D histogram. This is the default setting. |
| (0,1) (Shift+0) | Objects with colour values between 0 and 1. |
| Free (Shift+F) | Objects within a user-defined range. Use the Range field to navigate between views including the full range view and a percentage of the range. |
| Plot (Shift+O) | Objects with colour values between a range that comprises all values between 0 and 1, and the plot value. |
Range fieldDisplays the percentage of the full range that is displayed in the histogram. Editable when the Frame option box is set to Free.
Store buttonClick to store the current value in the Range field in memory for later use. Active when the Frame option box is set to Free.
Recall buttonClick to retrieve the last Range value that was stored in the buffer.
Change other display elements of the histogram using the Preferences menu. To access the Preferences menu, click Pref.

HistogramEnable to show or hide the histogram. Alternatively, use the H hotkey.

Histogram gridEnable to displays the resolution for the cubes:
Opacity fieldDisplays the opacity of the cubes. As you adjust the opacity, smaller cubes become transparent at a faster rate than larger ones. The default setting is 100% opacity.
Scaling fieldResizes the cubes. Cubes representing less prevalent colours (the smaller cubes) are scaled down more than those representing more prevalent colours. The cube of the most prevalent colour remains the same size (as set in the Histogram Grid box). By increasing the size difference between the colours of greater and lesser prevalence, you can see the main components of the colour space more clearly.
Threshold fieldRemoves the display of colours that are less prevalent in the image. As you increase the threshold, less prevalent colours are increasingly removed from the histogram.
The canvas is the black background of the RGB viewer. Control the display of the canvas using the Preferences menu.

(a) Canvas button (b) Canvas Light field
Canvas buttonEnable to show or hide the canvas. Alternatively, use the C hotkey.
Canvas Light fieldDisplays the amount of lighting in the RGB viewer. The light source emanates from behind the viewer.
You can show or hide a white outline of the borders of the RGB viewer, as well as green wireframe boxes around selected ellipsoids. Show the boxes to quickly identify the selected element, or hide them to reduce “clutter” in the viewer.


