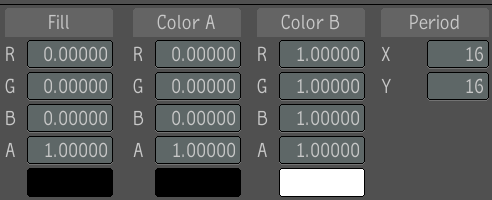
The Checkerboard tool lets you create images with a variety of properties and in several formats. The Checkerboard tool is comprised of three sets of color channel value fields and X and Y Period fields. One set of values is for generating the fill color, and two sets are for generating X and Y colors residing in the region of definition (ROD). The fill color is defined as those pixels residing outside the ROD. Two other controls let you adjust the size and look of the checkerboard in the X and Y directions.
To create an image using the Checkerboard tool:
 Except where otherwise noted, this work is licensed under a Creative Commons Attribution-NonCommercial-ShareAlike 3.0 Unported License


