


Viewing the results in
the Graph Editor
In the next steps you’ll examine the animation curve resulting from the driven keys you’ve set. If you are unfamiliar with animation curves and the Graph Editor, see Lesson 1: Keyframes and the Graph Editor.
To view the set driven key results in the Graph Editor
To display the animation curve for a driven key in the Graph Editor, you must select the object containing the driven attribute, not the object containing the driving attribute.
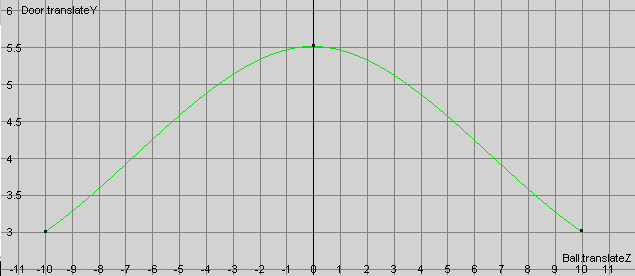
The column of numbers on the left lists the driven attribute values. The row at the bottom lists driver attribute values. The animation curve shows the relationship between the values—the door’s Translate Y value rises as the ball’s Translate Z value approaches 0.
You can use the Graph Editor to edit the shape of the curve to make the door rise faster, slower, and higher as the ball approaches it.