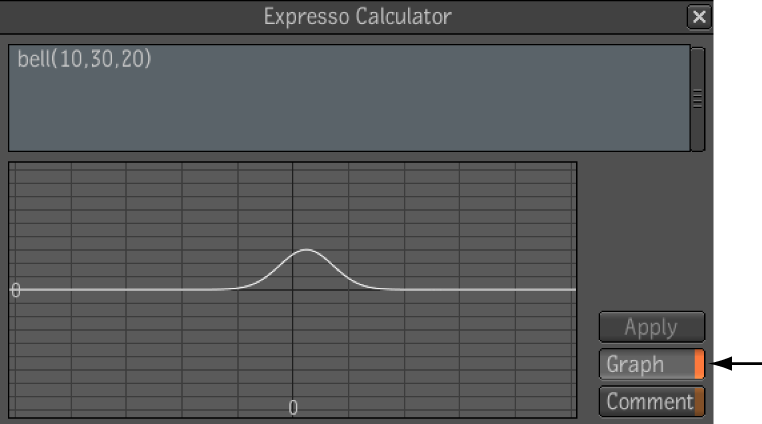
You can view a valid expression in a graph view by clicking the Graph button. The graph view displays the shape of the expression curve plotted over time. The initial time extents are the same as those of the composition.
You can also display the expression curve in the Animation Editor Viewer with other animation curves. The expression curve is visually differentiated by being displayed in a green line and will always appear underneath animated curves. The expression curves cannot be selected nor modified. To Display the curve, select the attribute containing the expression from the Composition Browser.