Command entry:
Main toolbar


(Curve Editor (Open))
Select a track in the Track View hierarchy.
Track View menu bar
Controller menu
Assign
Waveform Float
Command entry:Graph Editors
Track View - Curve Editor
Select a track in the Track View hierarchy.
Track View toolbar
Controller menu
Assign
Waveform Float
The Waveform controller is a float controller that provides regular, periodic waveforms. Created originally to control blinking
lights, you can use it on any float value.
To view how the trajectory of an object is being affected by the Waveform controller, turn on Motion panel Trajectories.
Procedures
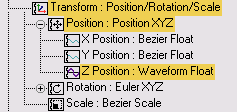
To use the Waveform controller to animate the visibility of a sphere:
- Create a sphere.
- Open Track View, and select the Sphere track.
- On the Tracks menu choose Visibility Track Add.
- Select the Visibility track, click Controller Assign, and select Waveform Float.
- Play the animation to see the effect.
To use the Waveform controller to animate the radius of a sphere:
- Create a sphere.
- Open Track View - Dope Sheet, and expand the Object (Sphere) track.
- Select the Radius track, click Controller Assign, and choose Waveform Float from the Assign Controller dialog.
-
 Play the animation to see the effect.
Interface
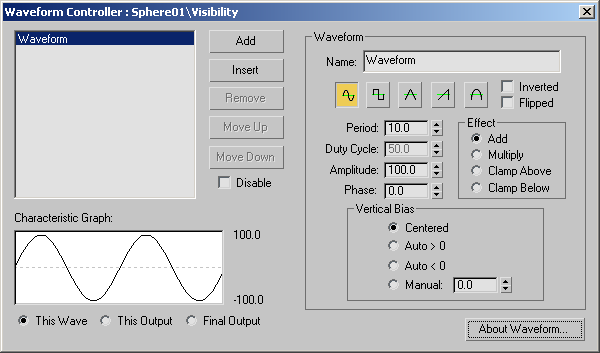
After assigning the Waveform controller, in Track View, right-click its track to display its properties in the Waveform Controller
dialog.
- List Window
-
Displays waveforms in a list.
- Add
-
Adds a new waveform to the end of the list. The default waveform is a sine wave with a period of 10 frames and with an amplitude
of 100.
- Insert
-
Inserts a new waveform before the selected waveform slot.
- Remove
-
Deletes the selected waveform. This is not available when only one waveform remains.
- Move Up and Move Down
-
Shifts the selected waveform up and down in the list, allowing the waveform order to be altered.
- Disable
-
Disables the selected waveform.
Waveform group
This group provides control parameters for the currently selected waveform.
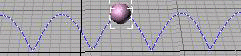
TipUsing the Sphere example, you can observe the waveform in the Function Curve displays of the Track View, and watch changes
in the waveform while testing the parameters described below.
- Name
-
Contains the name of the waveform.
- Waveform Icons
-
Specifies five waveform types: Sine, Square, Triangle, Sawtooth, and Half Sine.
- Inverted
-
Flips the waveform vertically.
- Flipped
-
Flips the waveform horizontally.
- Period
-
Sets the number of frames to complete one waveform pattern. Spinner Value=float, 0.01 to 9,999,999
- Duty Cycle
-
For square waves only, specifies the percentage of time the square wave is "on." Default=50, Spinner Value=float, 0 to 100
- Amplitude
-
Sets the height of the wave. Spinner Value=float, 0 to 9,999,999
- Phase
-
Sets the offset of the wave. Spinner Value=float, 0 to 1
Vertical Bias group
A waveform's output value can be altered by adjusting the Vertical Bias parameter. Spinner Value=float, -9,999,999 to 9,999,999
- Centered
-
Centers the waveforms vertical bias about zero. For example, a 100 unit amplitude waveform would range from -100 to 100.
- Auto > 0
-
Shifts the waveform above the zero line.
- Auto < 0
-
Shifts the waveform below the zero line.
- Manual
-
Lets you set the waveform manually by adjusting the spinner.
Effect group
Each waveform has an Effect parameter, which can be one of the following:
- Add
-
Causes the current waveform's value to be added to the previous waveform's output. This is the default.
- Multiply
-
Multiplies the previous waveform's output by this waveform's value.
- Clamp Above
-
Limits the previous waveform's output to be above this waveform's value.
- Clamp Below
-
Limits the previous waveform's output to be below this waveform's value.
Characteristic Graph
Characteristic Graph shows one of three displays, controlled by the radio buttons below the display.
- This Wave
-
Shows the current waveform only, independent of all other waveforms.
- This Output
-
Shows the output of the current waveform, including all previous waveforms.
- Final Output
-
Shows the output of all the waveforms in the list. You can also see the final output by turning on the Track View — Curve
Editor display for the track which has the waveform controller assigned.
All displays show the output graph of the controller waveforms in a solid dark line, with the zero line drawn in a dotted
gray line. Two numeric displays to the right show the high and low range of the waveform curve. The graph automatically scales
vertically to fit the waveform output curve, and scales horizontally to two times the period of the longest-period waveform.